
(Preprint of Charness, N., & Bosman, E.
A. (1992). Age and human factors. In F. I. M. Craik & T. A.
Salthouse (Eds.). The handbook of aging and cognition (pp.
495-551). Hillsdale, NJ: Erlbaum.)
Human factors has been characterized in a number of different ways. Two representative examples are "the discipline that tries to optimize the relationship between technology and the human" (Kantowitz & Sorkin, 1983), and the discipline whose goal is "designing for human use and optimizing working and living conditions" (Sanders & McCormick, 1987). Other terms sometimes used interchangeably with human factors are ergonomics (though ergonomics tends to restrict itself to dealing with the workplace) and engineering psychology, or human engineering. In short, human factors tends to be a discipline with a strong performance orientation, with the central theme being how to design products or processes to enable someone to do a task more efficiently and safely. The question of the appropriateness of the performance goal is left to the user.
As the preceding suggests, human factors is relevant to many aspects of daily living, from the design of household appliances and automobiles, to the design of buildings and transportation systems. The following briefly describes a few of the topics that fall within the area of human factors. Anthropometry is concerned with measuring the dimensions and functional capabilities of the human body. More specifically, anthropometry is concerned with measuring variations in the size of various body parts, and the range and strength of movements the body is capable of (Sanders & McCormick, 1987). Human-computer interaction is concerned with how to design computer software and hardware so that the use of computers by people is facilitated (Card, Moran, & Newell, 1983). Transportation engineers are concerned with the issues pertaining to the design of safe and efficient transportation systems (Committee for the Study on Improving Mobility & Safety for Older Persons, 1988), whereas illuminating engineers are concerned with the design of lighting systems for a wide range of indoor and outdoor settings (Kaufman & Haynes, 1981a, 1981b). Individuals focusing upon the man-machine interface attempt to design instrument and control panels so that the control of cars, planes, appliances, and other machines is efficient and relatively errorless (Sanders & McCormick, 1987).
Human factors is a comparatively young discipline: Two of the main journals in this area, Human Factors and Ergonomics, have just reached their early 30s. The application of human factors to issues in aging is about as old as the societies that spawned these journals. A classic work by Welford (1958), Ageing and Human Skill, represents one of the first attempts to link basic laboratory research about aging to practical issues. The long-term interest in this topic in the Human Factors Society (see Fozard, 1981) has led to the publication of two special issues on aging in Human Factors in the past 10 years (in 1981 and 1990). Nonetheless, there is still a paucity of reliable data on which to base recommendations and design decisions. As Smith (1990) commented in the most recent special issue: "Although the knowledge base for human factors and aging is weak and conceptual thinking is in its infancy, theorizing can play an important role in the emergence of any field of inquiry". (p. 509). As a result, part of our chapter is theoretical and speculative.
There are two primary approaches taken within human factors: a) studying human capabilities and modifying the tool or the environment to fit the needs of the human user, and b) modifying the user to work with a difficult-to-change or inherently dangerous tool or environment. The first approach is the more usual one: designing for the user. The second approach more often is subsumed under the issue of training techniques. Both approaches are needed to provide maximal benefit to user populations once the tool or environment assumes even a modest degree of complexity (contrast design and training requirements for a broom vs. an automobile). Given these orientations, differentiating human factors research from applied psychology (see chapter 9) is difficult. Perhaps the easiest way to proceed is to view applied psychology as dealing more with changing the human, and human factors as concerning itself more with changing the environment, usually in a way that improves cost-effectiveness and safety. It should be kept in mind that the nature of the human-environment interaction (see Parmelee & Lawton, 1990) affects both enterprises.
What can the study of human factors offer for older adults? Because aging often is accompanied by negative changes to the human condition, human factors research can play an essential role in improving the quality of life for older people through better design. Older adults now form and will increasingly represent a significant proportion of the population in both the western industrialized nations and the developing nations (Report of the World Assembly on Aging, 1982). "Know the user" is the credo of a good designer. Older users are becoming increasingly commonplace. Further, if environmental conditions interact with age to constrain performance, then the optimal environments for people will change with age.
First, we need to delineate what is meant by the term older adult. Traditionally the term has been reserved for those near or past retirement: those 60 years of age and older. In industrial gerontology, the term older worker often refers to those in the 40-45+ years range (Smith, 1990). Visual and auditory declines have been documented both cross-sectionally and longitudinally for the decade of the 30s and beyond (Fozard, 1990). Thus, a conservative use of the term older adult should probably be those age 40 years or above, a bit above the halfway point of life expectancy in industrialized nations.
Within the ranks of the older adult there are probably three distinct subgroups: those who are middle-aged, those still in the paid labor force (40-64 years); the old, those in the early and middle retirement years (65-74 years); and those who are in late old age (75+ years). Design issues for these three groups will vary. The criteria that design can be measured against fall into three overlapping categories: safety, efficiency, and comfort. A simple extension of traditional human factors approaches can deal with the age 40-64 years group. The primary concerns, we would predict, will center around workplace efficiency and safety. The age 65-74 years group likely will be perceived as targets for improved consumer product design, with safety and comfort (ease of use) being the probable focus. The age 75+ group will be the target of prosthetic products such as assistive devices that will enhance both basic activities of daily living (e.g., bathing, dressing, toileting and continence, feeding, transferring) and instrumental activities of daily living (e.g., shopping, house and yard work, financial maintenance, and driving), keeping them independent in their homes for as long as possible.
There are three important assumptions that must be met if human factors research is to be a useful complement to the study of aging:
1. It must be the case that optimal safety, efficiency, and comfort conditions for older adults differ from those for younger ones, else designing optimally for the young or the old will suit the entire population. Phrased in statistical jargon, age by condition interactions should be evident for the outcome measure, rather than solely main effects of age. To be safe, it is almost always better to design for the old when interactions are not disordinal (crossover), because the young may show no changes in performance across conditions, whereas the old do. Older adults may be more sensitive to design flaws, given the perceptual and cognitive changes that usually accompany aging. With disordinal interactions, design decisions are complicated, because different designs are optimal for different age groups. Fortunately, disordinal interactions are relatively rare.
2. It should be the case that variability in performance of older adults is not so great that design guidelines are hopelessly wide and hence too costly to implement. The choice of the term cost is intentional. It may be technologically possible to design an automotive vehicle that safeguards the lives of its occupants from a head-on collision at 100 km/hr. But, that vehicle may not be economically viable in the current marketplace. We examine cost-benefit issues later on.
3. To enable population estimates of performance to be meaningful, representative samples of older adults are needed. Such samples very rarely are obtained in laboratory studies, because the usual volunteer samples tend to be quite unrepresentative of their population cohorts (Camp, West, & Poon, 1989; Rosenthal & Rosnow, 1975; Todd, Davis, & Cafferty, 1983). Even survey research encounters difficulties in achieving representative samples, due to nonresponse for questionnaire, phone, and in-person interviews. In the case of laboratory studies, the problems are greater yet, because mobility is a usual requirement for entry into a laboratory setting. In some cases, it may be desirable to bring the lab to the person rather than vice versa. See Kelly and Kroemer (1990) for a good discussion of sampling issues related to anthropometric measurement.
Our chapter is divided up into four main sections. Initially, we summarize age-related changes in perceptual, cognitive, and physical capabilities that have implications for principles of design. We will then discuss some specific content areas within human factors and their relevance to older adults. This discussion necessarily is limited by space considerations, and the topics selected were those that have broad relevance for the daily lives of older adults. We begin with a detailed review and analysis of guidelines for optimizing the visual and auditory performance of older adults. Next we focus on a small number of areas of functional human factors: transportation environments, stressing the automobile, and work environments, stressing computer technology. In the third section we examine cost-benefit analysis, a tool that can be used to help make decisions about design implementation. Finally, we outline some guidelines and recommendations for future research.
There are three complementary sources of information about older adult behavior that can provide principles for design: epidemiology, laboratory research, and field studies. Epidemiology of aging deals with population statistics; for instance, determining whether age is a risk factor for the incidence of dementia, disability, and automobile fatalities (see Second Conference on the Epidemiology of Aging, 1980). Such research can provide valuable clues about age changes from macroindicators in the population. Nonetheless, descriptive data from epidemiology do not always pinpoint causal factors; rather, such data identify correlates (risk factors). We would classify this approach as problem identification, a top-down approach to design.
Laboratory experiments on aging (more accurately termed quasi-experiments, because age is not a manipulable variable) search for changes in microlevel processes in individuals. The phenomena explored range from the biological and physiological to cognitive and social. Such studies aim at identifying basic mechanisms or molecular processes that can account for age-related changes in performance at a more molar level of description. The expectation is that the identification of such basic processes should be able to provide the framework for causal explanations of any age-related differences in more complex activities, such as driving a vehicle. For instance, by knowing how identification and discrimination thresholds for visual and auditory stimuli change with age, employers should be able to design work environments that meet any special needs of older workers. Laboratory research represents more of a bottom-up approach to design, starting with molecular theories and working toward prediction of molar performance.
Field research involves two facets: observational studies and
experimental studies. Observational research provides a careful
description of the task environment in which people operate. Studies
can be concerned with gross descriptions of typical activity patterns
of older adults. The results of one such study by Moss and Lawton
(1982), plotted in Figure 10-1, indicate that television viewing
is, after sleep, a very time-consuming activity for old adults.
Human factors specialists looking at these patterns might become
concerned with ensuring that televisions (and VCRs) function well
for older viewers. Another approach might be to discover what
barriers have to be removed to permit the activity patterns of
dependent older adults to more closely resemble those of younger
adults.
Figure 10-1 Mean hours in an activity (adapted from Moss &
Lawton, 1982) for Independent Residents (N = 426, Mean Age = 75)
and Impaired Community Residents (N=164, Mean Age = 79).
At the next level of analysis, field studies may have the goal
of cataloging and describing in greater detail all the activities
that must be carried out to accomplish a specific task. For instance,
Clark, Czaja, and Weber (1990), expanding on Faletti's (1984)
pioneering work, provided a sound functional analysis of instrumental
activities of daily living after careful observation of older
adults carrying out tasks such as laundry, cooking, and shopping
in their usual settings. By correlating task demands with anthropometric
measurements of their population they could identify problem sources
(e.g., inappropriate heights for kitchen cabinets) and make suggestions
for redesign. Field research involves both top-down and bottom-up
approaches to design.
In general, the results of epidemiological studies, although indicating population trends, are not sufficiently detailed to help in formulating specific design guidelines for older adults. Experimental field studies, although providing valuable information, have not been sufficiently numerous to be useful in formulating general guidelines for design. Our approach has been to use the results of experimental and descriptive studies indicating the nature of age-related changes in perception, cognition, physical size, and motor performance as guidelines for design. Detailed descriptions of these age-related changes are available elsewhere (Charness, 1985; Fozard, 1990; Kelly & Kroemer, 1990; Kline & Schieber, 1985; Koncelik, 1982; Salthouse, 1985a,1985b; Stoudt, Damon, McFarland, & Roberts, 1965, 1973; Welford, 1977; Working Group on Speech Understanding & Aging, CHABA, 1988; see also chapters in this volume). We list some of the more salient ones for design in Table 10-1, offering an age epoch approach consistent with the view that there are distinct subgroups of older adults. The rationale for this approach is that design issues can be identified by looking at age-related changes, and predicting their effects on activities. For example, age-related increases in auditory threshold, particularly for high frequencies, have implications for the volume and frequencies of messages and warning signals employed in public places. Decreased physical strength with age has implications for how much strength should be required to open a jar of food or a fire door. Age-related slowing has implications for how much time should be allowed to complete certain activities, such as reading a traffic sign, or crossing a road.
| MIDDLE AGE (45-64) | OLD AGE (65-74) | LATE OLD AGE (75+) | |
| PERCEPTUAL | |||
| Vision | Near focus declining, hence needs reading glasses or bifocals. Increased susceptibility to glare. Less successful dark adaptation. Some decline in static and dynamic visual acuity. Some loss in ability to discriminate colors. | Little focusing ability left, and loss of acuity even with corrective lenses. Less (1/3 compared with young adult) transmission of light through to the retina. Greater susceptibility to glare. Slow dark adaptation. Significant declines in static and dynamic visual acuity, in useful visual field, and color discrimination ability. | Significant loss of visual acuity (dynamic and static), color discrimination, and extent of the visual field. Significant risk of visual dysfunction from cataracts, glaucoma, and macular degeneration. |
| Hearing | Some loss at high frequencies. | Significant loss at high frequencies and some loss at middle frequencies. Can be helped by hearing aid. Greater susceptibility to masking by noise. | Significant loss at high and middle frequencies. Likely needs a hearing aid. |
| Taste, Smell, Cutaneous Sensitivity | Minimal loss. | Minor loss. | Significant loss. |
| COGNITIVE | |||
| Response Time | Some slowing in response time. | Significant slowing in response time. | Pronounced slowing in response time. |
| Working Memory/Attention | Minor decline in learning ability and ability to divide attention. | Moderate slowing in learning rate and ability to divide attention. | Learning rate is halved from the twenties, and significant declines are observed for dual task performance. |
| Knowledge Base | Little change in fluid intelligence, and stability or increases in crystallized intelligence. | Some decline in fluid intelligence and stability or slight decreases in crystallized intelligence. | Significant declines in fluid and crystallized intelligence. |
| PHYSICAL AND MOTORIC | |||
| Size changes | Limited height loss and some weight gain. | Significant height and weight loss coupled with cohort differences that exaggerate these effects. | Cohort is significantly smaller and there is significant loss of height and weight. |
| Physical Strength | Modest decline in strength and aerobic capacity. | Moderate decline in strength and aerobic capacity. Some bone density loss. | Significant declines in physical strength and aerobic capacity. Significant bone density loss. |
| Balance and Mobility | Slight declines in balance ability with little mobility loss. | Significant declines in balance ability and some difficulties with mobility. | Balance likely to be impaired and mobility likely to be restricted. |
| Health | Fairly robust. | Greater susceptibility to chronic conditions (e.g., arthritis, diabetes, osteoporosis, hypertension). | The presence of multiple chronic conditions is highly likely. |
Consistent with this approach, we (Charness & Bosman, 1990a) previously outlined parameters for predicting the performance of older adults, following Card, et al. (1983). One of the motivations for collating age-related performance parameters was to try to provide for the possibility of "cookbook" solutions to design. Ideally, designers would like to know facts about their client populations, such as the size of lettering for signs that would be seen by 95% of the population of licensed drivers. Because it is unlikely that a massive effort will be mounted to establish such facts for each possible situation (e.g., for highway sign legibility in daylight, dusk, night, rain, snow, fog), it would be ideal to be able to derive them from laboratory observations. Nonetheless, it is important to stress that such parameters typically are derived from biased samples. If sound recommendations for design are the goal, representative sampling is an important means to that end. For the present, we will have to be satisfied with the first approximations that biased sampling bring us. It is incumbent on human factors research, however, to extrapolate findings based on advantaged volunteers by trying to run studies with less well-off older adults. Candidate populations would be those older adults who are physically or financially dependent, less well-educated, foreign born, rural, ethnic, and female.
Human factors specialists interested in aging typically have focused on the design implications of decreased visual and auditory capabilities with age. Such age-related declines are seemingly inevitable, and can have a profound impact upon the lives of older adults. For example, decreased visual acuity may hinder the performance of tasks that rely upon vision, such as shopping, cooking, driving, and most occupations. A loss of hearing ability may interfere with the ability to communicate with others, and may lead to social isolation. The age-related changes in visual and auditory capabilities outlined in Table 10-1 have fairly straightforward design implications that can be employed to develop general guidelines for optimizing the visual and auditory environments of older adults (for general discussions, see Boyce, 1981; Regnier & Pynoos, 1987; Sanders & McCormick, 1987; Working Group, 1988). The following presents a review and discussion of these design guidelines beginning first with the visual environment, and then proceeding to a discussion of the auditory environment.
Several characteristics of the environment and the task to be
performed will affect visual performance. Previously, we (Charness
& Bosman, 1990a) identified five categories of environmental
and task characteristics that affect visual performance, and for
which the optimal value of these characteristics is likely to
differ for young and elderly adults. The environmental characteristics
were level of illumination and amount of glare. The task characteristics
were size of critical visual details, contrast between critical
visual details and task background, and the ease of color discrimination.
The following discussion expands and elaborates our previous discussion
outlining the optimal value of these environmental and task characteristics
for older adults. Table 10-2 summarizes guidelines for optimizing
the visual environment of older adults.
A. Increase the level of illumination.
1. Extensive guidelines for specifying the level of illumination
for a wide variety of residential, commercial, institutional,
industrial and outdoor settings have been developed by the Illuminating
Engineering Society IES (Kaufman & Haynes, 1981b).
B. Accommodate for decreased rate and final level of dark adaptation.
1. Avoid sudden and pronounced shifts in illumination level, particularly at places with changes in floor level, or with other potential hazards such as obstacles, etc. (Regnier & Pynoos, 1987).
2. Have levels of emergency illumination adequate for older adults:
a) The (IES) (Kaufman & Haynes, 1981b) makes the following recommendations regarding emergency illumination for the general population:
i) illumination not less than 1% of normal amount, minimum of 5 lux;
ii) minimum illumination of 30 lux at all doors and hazards.
C. Control glare.
1. Location of glare zones:
a) Direct Glare Zone: relative to the light source, the zone from 90º to 45º degrees, with 0 being perpendicular to the light source (Cushman & Crist, 1987);
b) Indirect Glare Zone: relative to the light source, the reflected glare zone is from 0 to 45 degrees (Cushman & Crist, 1987).
2. Line of Sight Angle:
a) The line of sight refers to the path between the fovea and the object being viewed. Knowledge of where the observer is looking when performing a task makes it possible to position light sources so that they do not cause glare;
b) The reference point for determining the line of sight is the horizontal plane defined when the head is upright, and the subject is looking straight ahead. The deviation of the line of sight from the horizontal plane when viewing an object defines the line of sight angle (Kroemer & Hill, 1986);
c) Kroemer & Hill (1986) provide the following estimates of line of sight angle for targets distances of .5 to 1 m:
i) head and back upright: -29o + 20o;
i) head and back reclined: -20o + 20o;
i) head tilted: -40o + 40o.
3. Guidelines for controlling direct glare (Boyce, 1981; Cushman & Crist, 1987; Kaufman & Haynes, 1981b; Regnier & Pynoos, 1987):
a) position light sources as far away as practical from the operator's line of sight;
b) use several small low-intensity light sources rather than one large high-intensity light source.
c) use light sources with a minimum of luminous intensity in the direct glare zone;
d) increase the luminance of the area around any glare source;
e) use task lights with intensity controls and some method for adjusting their position relative to the task;
f) reorient the workplace and furniture if necessary;
g) shield light sources if necessary.
4. Guidelines for controlling reflected glare (Boyce, 1981; Cushman & Crist, 1987; Kaufman & Haynes, 1981b; Regnier & Pynoos, 1987):
a) position light sources so that no significant amount of reflected light is directed toward the eyes;
b) use light sources with diffusing or polarizing lenses;
c) use non-reflectant materials on walls, floors, and ceilings;
d) change the orientation of the workplace, task, and furniture; change the viewing angle, or the viewing direction in order to improve visibility;
e) keep the illuminance level as low as feasible;
f) use indirect lighting;
g) use a combination of top and side lighting.
5. Architectural modifications that reduce glare (Regnier & Pynoos, 1987):
a) overhangs on windows;
b) avoid windows at places likely to be the site of falls, such
as on stairways and other changes in floor level.
6. Evaluating the potential for glare-related visual difficulties:
a) Borderline between comfort and discomfort glare (BCD) index: The BCD indicates the level of illumination at which a light source will produce discomfort glare for individuals of different ages (Bennett, 1977);
i) BCD (foot lambers) = 25,000/age(yr).
D. Increase the size of important visual details.
1) Font size for printed material. The IES (Kaufman & Haynes, 1981b) makes the following recommendations for the general population:
a) minimum acceptable font size is 8;
b) for prolonged reading font size should be 10 or 12.
2) Letter size for signs. The Government of Canada (1987) recommended the following letter sizes be on signs to be read by older adults:
a) minimum size of 15 mm;
b) ratio of letter size to reading distance = 1:100 (i.e., at
distances of 100 m, letters should be 1m; at distances of 100
cm, letters should be 1 cm)
3) Additional means of increasing size of important visual details (Cushman & Crist, 1987):
a) decrease the viewing distance;
b) use a magnifying glass or microscope.
E. Increase contrast.
1. Increase contrast between visual tasks and background. Some
methods for doing this are improving print quality, using white
as opposed to gray paper, changing typewriter and printer ribbons
frequently, adjusting CRT brightness and contrast controls, using
ink pens rather than pencils, and by using contrasting colors
for different task objects and the background (Cushman & Crist,
1987).
2. The following luminance ratios for the general population have been drawn from the IES Handbook (Kaufman & Haynes, 1981b), and from Woodson (1981):
a) task to immediate darker surroundings: 3:1;
b) task to more remote darker surroundings: 10:1;
c) reverse the aforementioned luminance ratios if the task is
darker than the surrounding area.
3. Use contrast to emphasize changes in floor level, and other
hazards in the environment (Regnier & Pynoos, 1987).
F. Reduce the difficulty of color discriminations.
1. Regnier & Pynoos (1987) recommended that the following guidelines be used to reduce difficulties in color discrimination:
a) avoid discriminations in the blue-green range;
b) avoid discriminations among colors of the same hue.
2. A list of colors that are equally discriminable among the general
population appears in Woodson (1981), pp. 523-525.
3. For tasks where the difficulty of color discriminations cannot be reduced, or where accuracy of color discrimination is important, provide increased levels of illumination (see Kaufman & Haynes, 1981; Knoblauch et al., 1987).
One of the factors that affects visual performance is the level of illumination. In general, increasing the level of illumination results in improved visual performance. However, the benefit of increasing illumination follows the law of diminishing returns; subsequent increases in the level of illumination result in smaller gains in performance level, and at some point further increases in illumination do not result in improved performance. The point at which the function relating performance to level of illumination asymptotes depends on the visual difficulty of the task. For easy visual tasks the asymptote occurs at lower levels of illumination than for difficult visual tasks (Boyce, 1981; Cushman & Crist, 1987).
A consequence of various age-related changes in the eye, senile miosis, yellowing and opacification of the lens, and clouding of the vitreous humor, is that less light reaches the retina of an older adult (Kline & Schieber, 1985). Given that visual performance is in part dependent upon the level of illumination, a straightforward implication of these age-related changes is that older adults will require more illumination in order to see well. In general this expectation has been confirmed. Older adults do require more illumination in order to see well, although there is no consensus regarding how much more illumination is required (e.g., Boyce, 1973; Guth, Eastman, & McNelis, 1956; Hughes & McNelis, 1978; Hughes & Neer, 1981; Jaschinski, 1982; Ross, 1978; Simmons, 1975; Smith & Rea, 1978). Results usually differ between studies, and it is difficult to determine the cause of the conflicting results because different studies employ different tasks that vary in visual difficulty, and consequently in the amount of illumination required for optimal performance. In addition, most studies typically have not established the level of illumination at which further improvements in performance are not observed for the oldest subjects (see Smith & Rea, 1978, for an exception). Without this information it is not possible to establish how much more illumination is required to maximize the visual performance of older adults.
In North America, the most extensive guidelines for determining the appropriate level of illumination for a wide range of residential, commercial, institutional, industrial, and outdoor settings are those of the Illuminating Engineering Society (IES). A detailed discussion of the IES approach to specifying illumination level is beyond the scope of this chapter (see Boyce, 1981, Flynn 1979, Kaufman & Haynes, 1981a), however, a brief description is provided. The IES approach to specifying illumination assumes a positive linear relationship between task difficulty, as defined by the size of the critical visual details, and level of illumination. In addition, at a given level of task difficulty, other factors that affect task performance, such as the demand for speed and accuracy, reflectance of the area surrounding the visual task to be performed, and the ages of the individuals performing the task, also influence the amount of illumination required to optimize performance. In general, as the demand for speed and accuracy and the age of the individuals performing the task increase, and the reflectance of the task surround decreases, the IES guidelines recommend a higher level of illumination. Whether or not the IES guidelines are adequate for older adults has not been determined.
Given the difficulty in specifying the appropriate amount of illumination, it is sometimes suggested that control of lighting level be given to the individual (Fozard & Popkin, 1978). The assumption underlying such a recommendation is that individuals will select the level of illumination that will maximize visual performance. Although some studies indicate that individuals do prefer the level of illumination that results in optimal performance (e.g., Hughes & McNelis, 1978), others indicate that they do not (Boyce, 1981). The implication is that leaving lighting level under the control of the older adult may not always result in optimal illumination.
Glare refers to any light source that interferes with visual performance by either producing physical discomfort in the observers or reducing the visibility. One way in which glare may be categorized is according to the source of the glare. Direct glare is produced by a light source shining directly into the observer's eyes, for example, the sun or an incandescent light bulb (Boyce, 1981; Cushman & Crist, 1987; Kaufman & Haynes, 1981b). The effect of direct glare upon performance depends on how close the glare source is to the observer's line of sight. Generally, the closer the glare source is to the line of sight, the more likely it is to reduce the visibility of the target, and the lower the level of performance (Cushman & Crist, 1987). Reflected glare is produced by light that is reflected from objects that the observer is viewing, for example, light reflected from VDT screens, pages of books, glass windows. If light is reflected from a uniform surface such as flat paint, the reflected light produces veiling reflections (Boyce, 1981; Cushman & Crist, 1987; Sanders & McCormick, 1987). The effect of veiling reflections is to reduce the contrast between important visual details and the task background, a situation that will result in decreased visual performance (Boyce, 1981; Cushman & Crist, 1987).
Some of the age-related changes in the eye that decrease the amount of light reaching the retina also increase the susceptibility of older adults to glare. Specifically, the yellowing and opacification of the lens and the clouding of the vitreous humor, cause light to scatter within the eye which increases the likelihood that a light source will produce glare (Kline & Schieber, 1985). Ironically, increasing the level of illumination also increases the likelihood that a light source will produce glare. Consequently, it has been suggested that in order to control glare, illumination levels should be as low as is compatible with the maintenance of visual performance (Cushman & Crist, 1987).
Table 10-2 presents several guidelines for controlling direct and indirect glare. In general, these guidelines outline practices to be followed when positioning light sources and furniture so that the amount of direct and reflected glare in the environment is minimized. Although these guidelines seem reasonable, their effectiveness and whether or not it is practical to implement them remain to be determined. Several measures exists for evaluating the potential for glare-related visual difficulties (for a discussion, see Boyce, 1981; Kaufman & Haynes, 1981a, 1981b), but only one measure has been found that considers the effects of increased age. The Borderline Between Comfort and Discomfort Glare (BCD) index indicates the level of illumination at which a light source will produce discomfort glare as a function of age (Bennett, 1977). Although the BCD index does indicate that older adults will experience discomfort glare at lower levels of illumination than younger adults, the function presented by Bennett has not been validated in subsequent studies and its predictive validity is unknown.
The visual difficulty of a task is affected by the size in degrees of visual angle of the smallest critical visual details to be discriminated, and the contrast between the luminance of the critical visual details and the luminance of the background. Generally, decreasing task difficulty by increasing the size of critical visual details. or increasing the amount of contrast, will result in improved performance (Boyce, 1981; Cushman & Crist, 1987). Further, it has been found that making the visual component of a task easier by increasing the size of critical details, or increasing contrast, results in greater gains in performance than can be obtained by increasing the level of illumination. The point is that increasing the level of illumination is not a general panacea that will ensure high levels of visual performance. Modifying a task so that its visual component is easier is just as important as providing adequate illumination (Boyce, 1981; Cushman & Crist, 1987).
A number of age-related changes in vision suggest that older adults would benefit from both increased size of important visual details and increased contrast. There is an age-related decrease in visual acuity, even when corrective lenses are worn. This is probably due to among other things cell death on the retina and the scattering of light within the eye, both of which will result in an image that is somewhat degraded (Kline & Schieber, 1985). Although there is evidence to suggest that the visual performance of older adults is better when the size and contrast of important visual details is increased (Blackwell & Blackwell, 1971; Government of Canada, 1987; Ross, 1978), definitive guidelines have yet to be established. For example, the recommended font sizes listed in Table 10-2 may be too small for older adults, and in particular, the minimum acceptable font size of 8 may systematically inconvenience older adults.
The guidelines for improving contrast by using good quality paper and changing typewriter and printer ribbons frequently are again reasonable, but their effectiveness in enhancing performance is unknown. It is also not clear if the luminance ratios listed in Table 10-2 will reduce problems with transient adaptation for older adults. The available evidence suggests that for the general population the luminance ratios in Table 10-2 are overly conservative. Very few real-life environments achieve luminance ratios of less than 20:1, yet problems with transient adaptation are not frequently reported (Sanders & McCormick, 1987). Similarly, studies have indicated that performance on visually difficult tasks is not affected by luminance ratios of 110:1 (Cushman & Crist, 1987). The implication is that for the general population at least, luminance ratios do not have to be as tightly controlled as indicated in Table 10-2. Whether this is also true for older adults is unknown.
The ability to discriminate between colors as indicated by performance on the Farnsworth-Munsell 100 Hue Test decreases with age, particularly for colors in the blue-green range (Fozard, 1990; Kline & Schieber, 1985). Consequently, the difficulty of color discriminations should be minimized, and discriminations among colors in the blue-green range should be avoided. However, several studies have indicated that increasing the level of illumination increases the performance of older adults on the Farnsworth-Munsell, and that the improvement in performance associated with increased illumination is greater for the oldest adults tested (Bowman & Cole, 1980; Boyce & Simons, 1977; Knoblauch et al., 1987). Although the level of illumination that results in optimal color discrimination by older adults has not been established, an implication of these results is that when difficult color discriminations cannot be avoided, the level of illumination should be increased for older adults.
Although there is consensus regarding what characteristics of the visual task and environment must be controlled in order to maximize the visual performance of older adults, definitive guidelines have yet to be established. Many of the guidelines discussed previously are little more than rough approximations. Research is required to establish the amount of illumination that maximizes the visual performance of older adults for a wide range of tasks and levels of task difficulty. However, it is unlikely that increased illumination alone will be sufficient to overcome the effects of age-related changes in visual capabilities. It seems likely that some combination of increased illumination, increased size of critical visual details, and increased contrast will be necessary to maximize performance. Currently, the optimal size of visual details or optimal amount of contrast for older adults is not known, let alone how these task characteristics interact with level of illumination. Given the increased susceptibility to glare with age, it is important to keep illumination levels as low as is compatible with good visual performance, and manipulate task characteristics in order to improve performance. Further research needs to be done to establish when a glare source is likely to cause discomfort or decreased visual performance in older adults, so that glare-related visual difficulties can be minimized. Finally, human factors research seeking to optimize the visual environment of older adults has focused upon the impact of a limited number of age-related changes in vision, decreased acuity and color discrimination ability, increased susceptibility to glare, and the decreased amount of light entering the eye with age. Research is required to establish the human factors implications of age-related changes in depth perception, visual field size, dynamic visual acuity, and contrast sensitivity (for a related discussion, see Czaja, 1990; Sekuler, Kline, Dismukes, & Adams, 1983).
With regard to the auditory environment, the traditional focus in human factors has been on controlling the level of noise in the environment so that hearing loss is not produced and the ability to perform a task is not negatively affected by excessive amounts of noise (e.g. Kantowitz & Sorkin, 1983; Sanders & McCormick, 1987). An additional concern when dealing with older adults is to facilitate speech understanding and the detection of other important nonspeech sounds (e.g., warning signals), which are compromised by age-related increases in auditory threshold. The hearing ability of older adults is also more adversely affected by noise, reverberation, and echoes, and consequently, it is important to minimize these factors (Fozard, 1990; Regnier & Pynoos, 1987; Working Group, 1988). Table 10-3 elaborates and expands the guidelines we presented previously (Charness & Bosman, 1990a) for optimizing the auditory environment of older adults. As was the case with guidelines for optimizing the visual environment, all of the recommendations in Table 10-3 are reasonable given the nature of age-related changes in hearing. The following evaluates these guidelines, and indicates where additional research is required.
A. Increase the volume of important sounds.
1. Pure tones:
a) estimates of age- and gender-related differences in auditory threshold for pure tones can be found in Olsho, Harkins, and Lenhardt (1985);
b) avoid high frequency (4,000Hz plus) sounds (Regnier & Pynoos, 1987);
c) for warning signals and other important sounds use low frequency (1,000Hz to 2,000Hz) sounds that have reverberation. The rationale for using reverberation in this instance is that the physical sensation of vibration may alert individuals with severe hearing impairment. This may be critical in emergency situations (Regnier & Pynoos, 1987).
2. Speech:
a) estimates of age-related differences in speech reception threshold
can be found in Plomp & Mimpen, 1979.
B. Control background noise and reverberation.
1. Control background noise:
a) eliminate where possible constant sources of background noise such as piped in music, air conditioning, etc. (Regnier & Pynoos, 1987);
b) use sound-absorbing materials on walls, floors, ceilings, and
windows (Regnier & Pynoos, 1987).
2. Eliminate reverberation and echoes:
a) Plomp & Duquesnoy (1980) made recommendations regarding room acoustics for elderly adults;
b) when reverberation is present, pausing slightly after grammatically
strategic points may facilitate speech understanding (Davidson,
Schonfield, & Winkelaar, 1982).
C. Additional methods for facilitating speech understanding.
1. Facilitate use of visual cues when speaking and listening (Regnier & Pynoos, 1987):
a) arrange furniture in a circular or semicircular manner;
b) use furniture that can be moved easily;
c) restrict the size of conversation groups to between four and
six persons.
2. Avoid speaking too fast:
a) normal speaking rate ranges from 140-200 words/min. Speaking faster than this can adversely affect the speech understanding of older adults (Stine & Wingfield, 1987; Stine, Wingfield & Poon, 1986; Wingfield, Poon, Lombardi, & Lowe, 1985; Working Group, 1988).
Age differences in auditory threshold provide an initial means for determining the volume of important sounds. In the case of speech, age differences in speech understanding are not well predicted by age-related increases in auditory threshold for pure tones, and consequently, when seeking to maximize speech understanding, it is necessary to consider age differences in speech reception thresholds (Working Group, 1988). However, to accommodate for interindividual variability, in practical applications the volume of warning signals and speech probably will have to be significantly above threshold values. Research is required to determine how loud speech and other important sounds must be in a variety of environments if they are to be heard by the majority of older adults.
Such research also will need to consider the effects of background noise. Although it is clearly necessary to reduce background noise in environments that are likely to be frequented by older adults, in many instances it may be impractical to renovate buildings with sound-absorbing materials and modified acoustics or to eliminate the noise creased by heating and cooling systems. A more practical approach would be to determine the levels of background noise that interfere with the hearing ability of older adults, and attempt to maintain noise at or below these levels. Another useful approach would be to determine the signal-to-noise ratios required to maximize the hearing ability of older adults (see Working Group, 1988, for a discussion). Such research also should attempt to use noise similar to that commonly found in many everyday environments, rather than employing white noise.
Additional means of facilitating speech understanding, such as avoiding speaking too fast and maximizing the use of visual cues, are dependent primarily on the sensitivity of the speaker to the special needs of older listeners. Consequently, it may be necessary to instruct individuals working with older adults how to accommodate to the effects of hearing loss. It also seems likely that these guidelines will be most effective when dealing with small groups, and may not be effective in large groups or public places.
In this section we review human factors issues in transportation, focusing on three different modes of transportation: public transit, walking, and driving. Given the dearth of research into human factors issues concerning older users of public transportation, our discussion concentrates upon walking and driving. There are three key aspects to design for any component in the transportation system: efficiency, comfort, and safety. Efficiency usually can be taken to concern the goal of allowing access to a given set of destinations in minimal time and by allocating as little money as possible. Comfort refers to the physical and psychological well-being of users of transportation systems. Safety can be stated crudely as reaching your destination without injury. Comfort and safety sometimes can be viewed as different points on the same continuum. As always, there are tradeoffs between these design specifications. We are interested in the tradeoffs from the perspective of older users.
Given that about 800 people are killed and thousands more are injured every week in automotive accidents in the United States, you have to wonder about the current system's design characteristics. It often happens that the human is the most unreliable component in a system, so design ultimately focuses most intensely on human performance limitations. Mechanical failure of the vehicle is assigned primary responsibility for a very small percentage of accidents, sometimes as little as 1% (Huston & Janke, 1986).
As Hoag and Adams (1975) pointed out, there is little research into human factors for urban transportation systems. Part of the problem is due to lack of information on anthropometric measurements for the civilian population, and particularly for elderly people (see Charness & Bosman, 1990a; Kelly & Kroemer, 1990, for age-related summary information.) A good example of the problem is discussed by Hoag and Adams (1975) for passenger seating. If a seat is too high, there is excess pressure on the thighs, but if it is too low, excessive effort is needed to rise from the seat. The Hoag and Adams tables and discussion deal with 99th percentile women and do not take into account older women who are disproportionately short, a point graphically illustrated in Koncelik (1982, his Figure 8.3). Due in part to age-related height and weight loss and to cohort differences in body size, most older adults of today are smaller and weigh less than more recent adult birth cohorts. Further, depending on the nature of the survey question and sampling technique (Forbes, Hayward, & Agwani, 1991) between 30% and 50% of community-dwelling adults over the age of 65 years report some problems with mobility and likely would have special needs for transportation systems. As has been pointed out (e.g., Ashford, 1981), even when design is for the able-bodied older adult, general frailty may mean a much higher risk of injury (e.g., when buses accelerate or decelerate rapidly and passengers lose their balance). An empirical investigation of age as a risk factor seems worthwhile.
Given that older people tend to be slower and less agile than their younger counterparts, it is probably necessary to ensure that entrance and exit conditions in public transit vehicles meet their needs by widening aisles, providing grab bars, and improving seating. Hoag and Adams (1975) outlined a set of valuable suggestions. Allowing for suitable seating and shelter while passengers wait for transportation to arrive seems necessary. Providing an automated telephone system that enables users to determine when the bus will arrive at a given stop also alleviates waiting problems. Another concern for older adults is fear of crime while using public transit. Hoag and Adams stressed that even though crime is not a frequent event on public transportation, its perceived frequency is what determines acceptability.
As the most basic form of mobility, walking affords seniors access to their needs both in the home and outside it. In rural communities, when seniors no longer can drive and there is no public transportation available, walking is often the only means to independence. Ashford (1981) cited a study indicating that 87% of local shopping trips by pensioners were done by walking, as were 39% of trips to town centers.
Older pedestrians are apparently over-represented in pedestrian fatality statistics (Cross-National Study, 1989). In Germany in 1985, 52% of pedestrian fatalities involved those over age 65 years. In the Dutch city of Groningen, 60% of pedestrian and bicyclist fatalities involved those over 65. Svanborg (1984) indicated that among pedestrians killed in Sweden 48% are 65 years and older. Given that those 65 years and older comprise between 10% -18% of these populations it is clear that older pedestrians are highly at risk. (Even assuming that older citizens spend twice as much time in pedestrian-related activity as other segments of the population, they would still be overrepresented.)
It should not be assumed that the driver is always at fault. Evans (1988a) cited data showing that about one third of pedestrians who were fatally injured had blood alcohol levels in excess of .10, above most legal limits. Winter (1984) cited research showing that 18.8% of fatally injured pedestrians aged 65-74 years, and 6.7% of those aged 75+ years had been drinking. Mathey (1983) suggested that older pedestrians are particularly prone to unsafe road-crossing practices, such as crossing after a light has turned red, impatient or abrupt crossing, indefinite and indecisive behavior when entering a crossing, miscalculating the speed of approaching vehicles or their stopping distances, and so forth.
How might we improve design to avoid pedestrian accidents? On the changing people side of the human factors equation, Mathey (1983) proposed group training sessions and mass media instruction as potential techniques for influencing unsafe behavior by older pedestrians. However, an evaluation of such interventions by the Organization for Economic Cooperation and Development (Road Transport Research, 1986) suggested that past education and public training techniques have not been very effective in reducing accidents.
The other option is to change the environment in which people walk. Here we have to be speculative because there is virtually no field research to draw on. A frequently voiced complaint by pedestrians is that traffic lights do not permit enough time for crossing. Lengthening traffic lights is one possibility, particularly in view of the slower walking speeds of the elderly and the disabled (see the discussion by Charness & Bosman, 1990a). Whether the benefits outweigh the costs is difficult to determine, as the cost-benefit analysis that we present later indicates. Another suggestion would be to install special bicycle lanes to minimize pedestrian/cyclist accidents. Because older people are at much higher risks for falls generally (Sterns, Barrett, & Alexander, 1985), ensuring that sidewalk and road surfaces are hazard-free, with clear demarcations for changes in depth, makes sense. In countries such as Canada, when winter conditions create ice hazards in most locations, clearing and sanding or salting of walkways is essential.
As many have noted, pedestrians are seen as secondary when designing traffic light systems. If there are tradeoffs to be made, the pedestrian is expected to make them. Although there has been a movement to turn parts of city centers into vehicle-free zones (pedestrian malls), it has not made significant inroads in North America, though suburban shopping malls, which afford both safe walking conditions and climate-controlled comfort, have been extremely successful. Also, as most joggers know all too well, the hard paved surfaces of sidewalks and roadways, though ideal for rubber wheels, are not the most comfortable surface medium for walking and jogging and are very unforgiving for falls.
Psychological comfort is important too. Many older adults living in cities will not walk outside at night for fear of being attacked. Fear of crime is much greater than it should be, given the frequency of such attacks. Yet perceptions govern actions. Ensuring that areas are well lit and patrolled by police forces might allay some of the fears of all citizens, not just seniors.
Within North America, the automobile is the preferred mode of transportation. Even the most cursory examination of traffic on the roads reveals that the vast majority of vehicles are privately owned automobiles usually containing no more than one person. Although walking is an important form of transportation for seniors, and the amount and pattern of driving changes with age, driving remains a very important form of transportation for older adults. Loss of the ability to drive because of age-related declines often requires a significant change in lifestyle, and is associated with increased dependence.
Two issues are relevant to evaluating the safety of older adults while driving: likelihood of being involved in an accident as a function of driver age, and likelihood of being killed if involved in an accident as a function of age. As Evans (1988a; 1991) has showed, older drivers are far less likely to be involved in a severe crash (Figure 10-2), or fatal accident (Figure 10-3) than 20-year-old drivers, whether statistics are based on fatalities per million licensed drivers or on fatalities per unit distance traveled. The fatality figures are taken from the Fatal Accident Reporting System (FARS). These data are matched to other data bases that record ages of licensed drivers (Federal Highway Administration), as well as to surveys of vehicle use (Nationwide Personal Transportation Study) that estimate mileage of drivers (for a discussion, see Evans, 1988a, 1991). Although integrating such epidemiological data runs a variety of risks (e.g., if there is age-related under- or overreporting of miles driven, or if older drivers retain their licences but do not drive), the trends appear to be robust.
However, it should be noted that for both measures a U-shaped function is observed, with the peak at age 20 years and declining accident rates until the 40s and 50s, and then a rise which only becomes pronounced above the 70s. Women are less at risk than men over the entire life-span for fatalities per million licensed drivers, and become equal to men past the 50s for fatalities per unit distance traveled. The U-shaped function suggests that driver inexperience is a critical factor in accident rates in the early years and that declining physical and psychological capabilities are responsible for increases later on, another example of the age/skill tradeoff (Charness & Bosman, 1990b).
Further, older drivers are also less of a risk to pedestrians than younger drivers (Evans, 1988a), whether using a measure such as pedestrian fatalities, or pedestrian fatalities per million licensed drivers, or pedestrian fatalities per unit distance traveled, though with the latter measure there is a noticeable rise for drivers above age 60 years . If a pedestrian is killed by a driver, it is nearly 10 times more likely to be by a 20- 30-year-old than by a 70- 80-year-old. In short, though older drivers are more likely to be involved in accidents than middle-age drivers, they are far safer than 20-year-old drivers, no matter which statistic is chosen.
The consequences of being involved in an accident show a different pattern, however. Older drivers and passengers (65+ years) are from three to four times more likely to die from injuries incurred in automobile crashes (Evans, 1988a, 1988b) than younger (20-year-old) drivers. These risk ratios hold whether you examine those wearing seat belts or those not wearing seat belts, as well as for every seating position in the automobile, suggesting that biological factors associated with aging are important (Evans, 1988b). These age-related increases in accident fatalities speak eloquently to the need for a better designed transportation environment, particularly when considering that accidents resulting in nonfatal injuries are about 30 times as frequent as accidents resulting in fatalities. Nonetheless, as Evans (1991) noted, such risk-factor multiples should be kept in perspective. Thirty years ago the fatality rate was three times as high as it is today in the United States, and even today, some countries have fatality rates over three times as high.
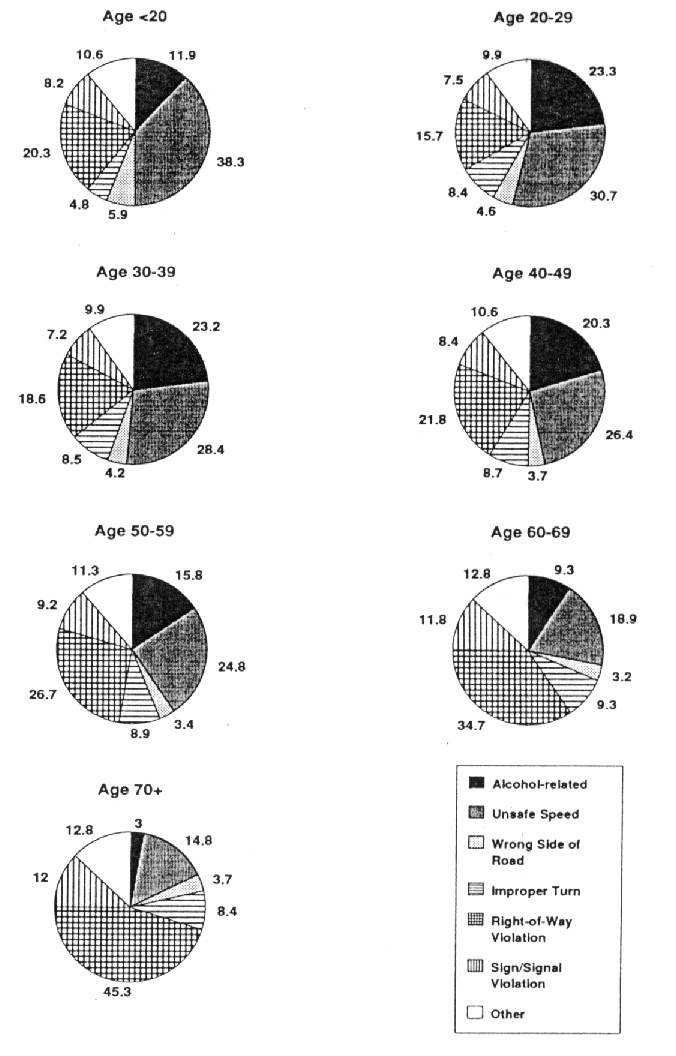
A number of studies indicate that the type of violation associated with an accident varies with age. Figure 10-4 gives results from Huston and Janke (1986) based on California Highway Patrol data from 1983. Speed is the most frequent violation assessed for nonfatal accidents incurred by young drivers, whereas a right-of-way violation is the most frequent violation associated with older drivers. A very similar picture results from examination of fatal accidents. For younger drivers, alcohol- and drug-related violations become the overwhelming attributed cause. Right-of-way violations remain the most significant factor for the oldest adults. These data are remarkably similar to California Highway Patrol data summarized earlier by Harrington and McBride (1970), indicating that attributed accident causes have remained quite stable over the years, despite striking changes in the road environment and the automobile.
When you examine the percentage of accident types within age groups
to control for differing frequencies across age groups, the results
are even more dramatic, as seen in Figure 10-5.
It should be noted that there are problems with the attribution of accident fault. Planek (1972) cited data showing that 15% of single-car accident fatalities died within 15 min of their accident from "natural causes," with coronary artery disease the assumed cause for 94% of these cases. Accidents may follow heart attacks as well as be the precipitating cause. A study by Waller (1967) did not show a significant relation between cardiovascular disease and 3-year accident rates or violations (mileage adjusted) for older drivers, though presence of dementia was a significant risk factor for older drivers for accidents and the joint presence of cardiovascular disease and dementia resulted in three times as many accidents as a comparison group of healthy aged 60+ years drivers.
It is currently not known what is the cause of different types of accidents or why the frequency of accident type varies with age. We would like to suggest that the accident types in Figure 10-5 denoted by solid-shading may be the result of risk taking (driving while impaired or speeding), whereas those indicated by hatching may be the result of breakdowns in perceptual-cognitive processing (failing to see a traffic light, stop sign, or oncoming vehicle). More specifically, a driver is probably aware that driving at excessive speeds or while impaired increases the likelihood of an accident. Thus, accidents involving these factors may be the consequence of risk-taking behavior. Alternatively, accidents involving failure to yield right of way or turning when unsafe seem more likely to result from perceptual or cognitive errors such as inaccurately estimating vehicle velocity, not reacting soon enough to an unexpected hazard, and so forth. Thus, it is possible that for younger adults many accidents are attributable to risk-taking behavior. In contrast, the types of accidents older drivers are involved in could stem from age-related declines in the efficiency of perceptual and cognitive processes (Charness, 1985; Panek, Barrett, Sterns, & Alexander, 1978). General slowing in response time with age (Birren, Woods, & Williams, 1980; Cerella, 1990; Salthouse, 1985a, 1985b) could result in a failure to react quickly enough in emergencies. Age-related changes in visual perception also could predispose older drivers to certain types of accidents. For example, it could be the case that older drivers have a higher percentage of right-of-way accidents because of a decreased ability to judge speeds of oncoming vehicles (Scialfa, Guzy, Leibowitz, Garvey, & Tyrrell, 1991), making them more likely to err in gap detection situations. We first consider changes in visual perception, and then look at the impact of slowing upon the driving performance of older adults.
It might be expected that there would be relationships between accident and violation rates and visual capabilities. Unfortunately, the evidence is not always consistent. Level of visual acuity, either static or dynamic, does not seem to be related in a consistent way to accident records for drivers. In a general review, Planek (1972) cited contradictory studies. The Burg study, using volunteers, found that those with better visual acuity scores had better driving records, though the correlations were generally quite low. The Crancer study compared male drivers between ages 50 years and 70 years who had clean driving records over the previous 6 years and those who had two or more accidents over the previous year, or two accidents and two violations within the previous 24 months. Poor-record drivers had better vision (static and dynamic acuity, glare resistance) than the good-record drivers!
Some have suggested that poor correlations are to be expected given the transient nature of accident-provoking factors. Sivak (1981) pointed out that it is unlikely that safe driving performance exceeds human capabilities "given a sober, physically and mentally healthy individual who is not under the influence of fatigue, acute stress, or other undesirable transient states" (P. 62). Unfortunately, people are not always operating vehicles in such ideal conditions. Sivak cited research showing that those in divorce proceedings have twice the accident rate of controls, and that 80% of fatalities in one study had experienced one stressful event in the previous 24 hr. As many have pointed out, old age is often a time of loss and it may be expected that older drivers are disproportionately exposed to stressful conditions.
However, other evidence is consistent with the view that age-related changes in visual perception do affect driving ability. At a very fundamental level, having normal visual fields seems critical to being able to spot events in peripheral vision. It is also known that the size of the visual field shrinks with age (e.g., Cerella, 1985). Johnson and Keltner (1983) screened 10,000 drivers with visual perimetry equipment. They found that there was an age-related increase in visual field abnormalities (about 3% below the age of 60 years , about 13% for those over 65 years of age). Further, for those with binocular visual field loss (1.4% of the sample), accident frequency and convictions over the previous three-year period were almost double those of age- and sex-matched controls with normal visual fields. Those with monocular loss did not differ significantly from controls in accident and violation frequency, though they were marginally higher.
Being able to read and respond to signs and signals is a critical part of driving. Older adults have much greater difficulty reading and responding to signs in both simulated video tests using sign detection (Evans & Ginsburg, 1985; Woltman, Stanton, & Stearns, 1984) and in simulated road tests using character orientation identification (Sivak, Olson, & Pastalan, 1981). In the latter case, nighttime performance was tested for age groups equated for daytime static visual acuity. In a later study, however, it was found that when older drivers are equated with younger drivers on low luminance acuity, there are no longer any age differences in performance on the orientation identification task (Sivak & Olson, 1982), even in the presence of glare. Older drivers are also slower to make same-different judgments, particularly for symbolic signs (Halpern, 1984), though visibility distance thresholds favor icon over text signs (Kline, Ghali, Kline, & Brown, 1990), particularly in dusklike lighting conditions. Most of these studies have used very small samples (usually 10 or fewer per age group), and those that matched for acuity across age groups may underestimate the true relation because acuity declines with age, particularly static acuity under low illumination (Sturr, Kline, & Taub, 1990).
Similarly, as Mourant and Langolf (1976) noted, much higher intensities and/or larger letter sizes and contrast ratios are required for luminance specifications for automobile instrument panels to accommodate middle-age and older (45+ years) drivers. There is a bit of a balancing act required though, because luminance levels should be kept low enough to maintain dark adaptation (<3.4 candelas/m2) and to avoid disability glare (<17 candelas/m2). Another problem with instrument panels for older adults is that with increased age past the 50s it is difficult to focus at near distances (presbyopia) and also to change accommodative focus between near (instrument panel) and far (road) points. There is some hope that "head-up" displays, already popular in aircraft, will make their way into motor vehicles. Such displays project information onto the windshield at a perceived visual depth that more closely coincides with the resting focus point for older adults (Sojourner & Antin, 1990).
Another significant feature of driving is picking the right stimulus to attend to out of the complex array of objects in the visual field. Individual differences in the ability to identify an object embedded in a field of irrelevant objects represent differences in "field dependence/field independence" (Witkin et al., 1954). Field dependence, as measured by the embedded figures test, has been found to be correlated with a measure termed spare visual capacity, keeping your eyes closed during straight-road driving for as long as possible (Shinar, McDowell, Rackoff, & Rockwell, 1978). In that study both eyes-open measures and field dependence were higher in a small sample of older (N = 9) than younger (N = 6) drivers. Field dependence measures also have been found to be correlated with accident rates (e.g., Avolio, Kroeck, & Panek, 1985), and particularly for accident rates among older commercial drivers (Mihal & Barrett, 1976). In the latter study, a selective attention measure (dichotic listening task) and a complex reaction-time task (choosing the correct action -- braking or turning -- from a photograph of a traffic situation) were also significant predictors of accident rates for the preceding 5 years, with the relationships stronger for older (age 45-64 years) than younger (age 25-43 years) drivers. In this study, accident frequency was correlated r (73) = .38 with age.
A more promising approach to examining attention and visual field effects has been to use the useful field of view measure (UFOV, Owsley, Ball, Sloane, Roenker & Bruni, 1991). Viewers of a video display terminal are asked to make same/different judgments for displays with two central targets (car, truck in two lanes) presented very briefly (12.5 ms-250 ms) followed by a random noise mask. A secondary task involves radial localization (determining the meridian) for a peripheral object. Pass/fail scoring for UFOV was a significant predictor [r(51) = .36] of prior 5-year accident rates for a group of 57 to 83 year-old Alabama drivers. Cognitive performance on a mental status test was about equally good (r = .34), with the two measures combined accounting for 20% of the variance in accident rates. Prediction was even better when only accidents at intersections were considered. In this instance the proportion of variance accounted for was 29%.
Perhaps the most critical driving performance measure, from an accident avoidance perspective, is following the car ahead of you, and matching your speed and braking to that driver, the "platoon driving" task. A recent field study, albeit with a very small sample (N=10), showed that the older group (M=66 years) was no worse than a comparison group (M=30 years) on brake reaction time, delay, and a correlation coefficient that summarized general following performance, though both groups were much better than brain-damaged younger drivers (Korteling, 1990). Further, little relation was found between laboratory reaction time tasks and the field measures for either of the older or young control groups. The author attributed the lack of slowing on the realistic task to an effect of driver experience.
Another critical feature of safe driving is the ability to respond quickly to unexpected obstacles, an operation that could be expected to be affected by age-related slowing. Various highway design specifications give 2 s - 2.5 s as the minimal time. Olson and Sivak (1986) arranged for a field experiment of slowing in obstacle avoidance by placing a piece of yellow foam rubber in the driver's lane at a hill crest location where, on average, the obstacle was visible at a distance of about 46 m. Generally, perception-response times of older adults were about the same as the younger ones in the surprise condition (Median= 1.1 s, with the 95th percentile response time for both groups about 1.6 s), though the authors did not report significance tests, preferring to plot the percentile response plots for each group. (Perception time, defined as the time to lift the foot from the accelerator pedal, was a bit slower in older than younger adults, but response time, defined as the time to contact the brake pedal from accelerator pedal release, was slightly faster.) Here too, with experienced older drivers, there was little evidence of a problem with slowed response.
The failure to find significant age effects in these field experiments is intriguing given the pervasiveness of age-related decreases in perceptual acuity and slowing. It may be the case that the perceptual, cognitive, and psychomotor changes that occur with increased age are outweighed by the experience that older drivers have accrued, enabling them to compensate for such changes. Still, it would seem to be important to supplement the field study of obstacle avoidance with variables such as divided attention (e.g., have the drivers look for street addresses) to simulate a range of typical driving conditions, before concluding that there are no age differences.
Another explanation for the lack of correlation between laboratory and field measures may have to do with the base rate problem. Accidents do not occur very frequently on a per-miles-driven basis. The absolute frequency of accidents should be much greater for commercial drivers7 , thereby improving the chance to find significant correlations with laboratory variables. Finally, it may be the case that older drivers who suffer accidents share with their accident-prone younger counterparts poor calibration between their confidence in handling risky situations and their competence (Matthews, 1986). That is, young and old drivers may overestimate their ability to handle inherently risky situations compared with their peers; middle-age counterparts rate their abilities as similar to their peers. Such results are consistent with a calibration or metacognition problem.
How could vehicles and road systems be redesigned to cut down accident frequency? We offer some speculations. Speeding and alcohol and drug abuse are not addressed easily, though these violations assume less importance for older drivers as shown earlier. Better law enforcement may help somewhat (particularly by moving more to issuing warnings than tickets: Van Houten & Nau, 1983), though changing society's attitudes toward these violations is essential to solving the problem. Highway speeding is eliminated easily enough by designing cars that cannot speed (through the use of governors), though this solution has never been acceptable in North American society, which covertly and overtly sells vehicles based on speed and acceleration capabilities. The lowering of the speed limit on U.S. highways to 55 miles/hr during the oil crisis some years ago may well be responsible for some of the recent decline in fatal accidents, because speed at impact is strongly related to severity of injury (MacKay, 1988). Lowering speed limits represents a very inexpensive way to reduce speeding on the highways, assuming that drivers comply. Also, the negative effect of high gasoline prices on travel is a likely cause of fewer deaths. Less travel means fewer accidents.
Right-of-way violations can be minimized with better road design, particularly in highway settings. As Solomon (1985) pointed out, the U.S. Interstate system, which carefully controls access via ramp systems, has mileage-based accident and fatality rates that are one third to one half of those for conventional highways carrying similar traffic loads. Highway construction costs (cited in newspaper articles) are sometimes in the several million dollars/mile range for difficult terrain. Money (1984) cited estimates by the U.S. National Highway Traffic Administration that accidents in the United States annually cost more than $50 billion in lost income, medical costs, insurance costs, and legal expenses. That figure probably can be doubled to arrive at today's costs. It is difficult to justify thousands of miles (billions of dollars) of new highway construction on safety grounds alone unless a very high percentage of accidents could be avoided that way.
Another way to minimize accidents that may be due to failure to notice signs is to improve lighting of signs and possibly to improve headlamp performance, which is critical for night driving (Mortimer, 1988). The older eye transmits light less effectively. But with increased intensity of the light source comes increased opportunity for glare. We concentrate on glare from headlights of motor vehicles. Night driving demands that headlamps provide as much visibility as possible, particularly when the vehicle is traveling at high speeds. Unfortunately, on two-lane roads, increased illumination power for headlamps results in increased visibility for the driver, but also increased glare for the driver on the other side of the road. It is not simply a matter of changing the headlamp beam pattern, because it is necessary for light to be projected into the same plane as the oncoming driver's eyes in order to illuminate road signs (see Olson, 1988). The more light in the plane of the sign, the less expensive the reflective coating on the signs needs to be. So older drivers, who have a greater need for illumination of both the road and road signs, also would suffer the most from the increased glare that any proposed increases in headlamp illumination would bring. Older drivers report much lower frequencies of night driving than younger drivers (Planek & Fowler, 1971), perhaps responding adaptively to the double jeopardy situation that they face.
One high-tech design option for minimizing older driver right-of-way and sign violation accidents is to use radarlike warning devices within automobiles to alert the driver auditorally to possible road hazards or to pedestrians (Yaksich, 1985) and to have lights and signs broadcast a signal that could be translated by a device in the car into different auditory warnings (to supplement the visual one) when drivers approach intersections. Although such devices are technically feasible, it is probably not yet economically feasible to install them in 180 million vehicles and at millions of traffic intersections, though pilot projects are probably warranted. Careful feasibility studies are needed accompanied by cost-benefit analyses. The problem with accidents is that, fortunately, they are still relatively rare events on a per-vehicle-mileage basis, and there is undoubtedly a point of diminishing returns for further investments in safety devices. A totally risk free transportation system is impossible.
Because it is unrealistic to believe that all accidents can be eliminated through design, minimizing the effects of collision on motorists and pedestrians is a worthwhile goal. It is possible to design vehicles to minimize internal impacts with automobile surfaces (for instance, through installation of air bags), as well as to design external surfaces to minimize injury for pedestrians (MacKay, 1988). Again, cost-benefit analyses are needed to determine whether such modifications are economically viable. Our suspicion is that government regulation probably will be the most fruitful way to prod manufacturers to make the necessary changes, though the current highly competitive marketplace, steeply rising car insurance costs, and an aging population may accelerate the process. Unfortunately, until very recently, safety has not been a selling point for automobiles, probably because people would rather not acknowledge the risk of injury through accidents when contemplating a purchase.
Some have taken the higher risk of accident involvement by older drivers (compared to middle-aged drivers) as a sign that stiffer licensing arrangements are needed. As Evans (1991) noted, older drivers are considerably less of a risk to themselves and others than are young drivers. Older drivers reduce their driving distances considerably and drive less during high-risk times such as during rush hour and at night, probably responding adaptively to age-related changes that make driving a less comfortable experience for them. The problem for older drivers is more likely to be one of diminished mobility than diminished driving capability. Nonetheless, high-risk subgroups within the older population, such of those in the early stages of dementia, should probably be carefully screened.
Another approach to accident avoidance is to redesign the driver, that is, to provide training programs to eliminate unsafe driving practices. Older driver training has become increasingly popular in the United States through programs sponsored by the American Association of Retired Persons (55 Alive/Mature Driving), the American Automobile Association, and the National Safety Council. Formal evaluations of the efficacy of these programs are very infrequent. The few attempts that have been made have not shown any differences in accident rates between volunteer trained groups and waiting group controls. For instance, in one large (N=10,000) study, because of high dropout rates (only 21% remained in training and provided follow-up accident data) the final samples were no longer random so the lack of differences is not interpretable (McKnight, 1988).
As mentioned earlier, seating standards, based on 99th percentile anthropometric data, systematically inconvenience older women who, ironically, are the fastest growing group of older drivers (Winter, 1984). Seating position is also critical for visibility of the road, and short older women will have a reduced field of vision of the road ahead. One idea for designers would be to adopt an age-weighted driver-related 99th percentile standard. Another would be to provide slightly more expensive seating that has greater adjustment capability.
There is more to comfort in driving than physical comfort. Psychological comfort may well be one of the important factors in the marked reduction in mileage driven by older drivers. Evans (1988) noted that the average annual distances traveled for male drivers is 31,400 km for those aged 35-39 years, and 14,500 km for those aged 65-69 years. (Some of the reduction may well be due to elimination of the need to drive to work following retirement.) Certainly reductions in the amount of driving at night, on highways, and during rush hour by older drivers fits with the idea of psychological discomfort. Because accident risk is directly related to mileage (exposure), such reductions are probably adaptive, though restricting.
There is an interesting ethical dilemma facing designers. Should they succeed in making the driving environment more comfortable for older drivers, whose risk of accident on a per-mileage basis is higher than that of middle-age drivers, more older drivers will be killed and injured as they are encouraged to drive greater distances. Determining how mobility gains balance these accident losses is more than an academic exercise. Unless accident risk (per unit distance traveled) can be reduced at a faster rate than the increase in travel distance we may be spinning our wheels both figuratively and literally with respect to accidents.
In summary, older adults are at much greater risk for personal injury as transportation users, particularly as pedestrians, but also as drivers compared to middle-age adults. Some of the increased risk can be traced to age-related changes in physical, perceptual, and cognitive functioning. Better design can be expected to help mitigate the greater risks, but whether such changes are cost effective is at present unknown. Similarly, older transportation users are probably the least likely segment of the population to be comfortable and secure when using transportation systems. Low-cost design modifications probably could rectify some of this discomfort. Further, in almost every case, modifications aimed at improving the comfort and safety of older users probably would benefit other segments of the population.
Human factors will become increasingly concerned with the graying
of the labor force. As Figure 10-6 shows, the work force is aging
along with the rest of the population.
In the next few decades, those in the 45-64 year age range who have been in balance with new entries in the labor force will practically equal those who have usually been the largest component, 25 to 44-year-old workers.
Human factors research in the office environment has been focused on two main issues: safety and productivity. Safety research usually is concerned with reducing accidents and work-related disabilities (such as back injuries and repetitive strain injuries). A typical concern is the design of safer machine-human interfaces. Productivity concerns focus on the design of better tools, instruments, and displays, as well as on how to structure the sequencing of activities and layout of work space to permit efficient movement within and between activities. Because vision is such an important component, there is a large literature concerning visual characteristics such as lighting, contrast ratios, and display types.
Earlier we outlined the changes in vision and hearing that occur in late middle age. Such changes have profound implications for safety and productivity in a workplace that will depend increasingly on older workers. Perhaps equally important are the cognitive changes that can be expected for older workers, the most salient of which is learning rate. Most memory studies show, for intentional learning situations, that older adults learn less effectively than younger ones (see Chapter 2 of this volume). We concentrate on what such age-related changes mean for a workplace that is becoming increasingly volatile and dominated by changes in technology. We focus on the use of microcomputer systems, simply because they represent the most rapidly growing sector of new business equipment. Further, there is some indication that such systems are also finally penetrating the home market.
Probably the prototypical product for human factors research is the computer system8 . Ten years ago, if you wandered through most offices in North America, you might have seen a few terminals connected to a central mainframe computer. Today, on many desks you will find a microcomputer - some with about the same computing power as that old mainframe and virtually all with better human-computer interfaces. However, because of their design, microcomputer systems can stress the visual, manual, and learning capabilities of workers, particularly those of older workers.
Most microcomputers systems have a screen that transmits light via a cathode ray tube (CRT) much like that in a typical television set. An exception is the laptop or notebook computer, which typically has either a liquid crystal display that is backlit and/or reflects ambient light, or a gas plasma display. The challenge with all these device types is positioning, resistance to glare, and presenting high enough contrast ratios for text and graphics so that the viewer easily can perceive what is on the screen. A great deal of research has been done examining screen characteristics affecting legibility, particularly concerning factors such as size, color, and type of text characters. Almost all this research has been carried out using young adults (for reviews see Grandjean & Vigliani, 1980; Helander, 1987).
Positioning can present special problems for presbyopic older adults who use bifocal lens systems. Typically, near vision is in the lower half of the lens and distance vision is in the upper half. If a screen is mounted on top of a computer, an older adult will be forced to tilt his or her head up sharply to use near vision, contravening standard recommendations9 that the screen be about 30º below the line of sight (Kroemer & Hill, 1986; see also Table 10-2). Use of reading glasses designed for near vision only or the addition of a third lens for near distance above the far distance lens may help. As well, monitors often can be placed directly on the desk in front of the keyboard, with the main computer box off to the side. Still, given that older adults tend to have poorer posture (head tilted down), such repositioning may not compensate adequately for all older adults. Laptop computers have the advantage that their screens are positioned quite low in the visual field but the disadvantage that the screens tend to be smaller and that screens (LCD or gas plasma) have lower contrast ratios and are less glare resistant than CRT devices.
As technology has advanced, the density of screen characters has improved on the typical monitor found in a business environment. Only a few years ago, the most popular color screen used a 640 (horizontal) x 200 (vertical) pixel (picture element) matrix with text characters plotted in a 5 x 7 array. The more usual color system today uses a 640 x 480 pixel array with 7 x 9 boxes for text symbols. Early research (e.g., Pastoor, Schwarz, & Beldie, 1983) showed that the denser the array, the better the visual performance through character sizes of 9 x 13, though character size (visual angle) was confounded with density. However, a recent study with a high-resolution monitor showed little difference for a one hour reading aloud task with 12 x 14 versus 8 x 9 character matrix sizes, (Miyao, Hacisalihzade, Allen, & Stark, 1989). It is unknown whether age is an important factor, but it seems likely that denser, higher contrast displays would be even more beneficial for older viewers. Similarly, instead of using fixed width characters, newer graphical interfaces have attempted to use variable width characters, bringing displays of text more in line with traditional printed text. Such displays may yield a slight reading speed advantage (6%; Beldie, Pastoor, & Schwarz, 1983), but again, it is unknown whether variable width fonts aid older viewers disproportionately. Given the rapid advances in display technology, it seems likely that by the time the relevant research has been conducted, megapixel displays with carefully tuned character fonts will have become commonplace in the office environment. Such displays can eliminate the usual difference in reading speed favoring paper over the CRT, when contrast, antialiasing, polarity, and other factors are optimized, at least for young adults (Gould, Alfaro, Finn, Haupt, & Minuto, 1987).
There is a large human factors literature devoted to control devices (see Sanders & McCormick, 1987, chapter 10), and a growing body on computer input devices (Greenstein & Arnaut, 1988). The keyboard is still the major input device for working with a computer system, though alternatives such as the mouse, touchscreen, trackball, light pen, joystick, and digitizing tablet in combination with menu-driven software are assuming an increasing role. More exotic devices such as the glove and voice-driven, handwriting-driven, or eye movement-driven systems also are being explored. There are also specialized controls for the severely disabled population (e.g., mouth-driven controls).
Much of the research on input devices for computers has focused on the relative merits of such devices, particularly for positioning tasks such as target acquisition. Early work focused on so-called Fitts' Law devices, such as cursor keys, joystick, and mouse (e.g., Card, English, & Burr, 1978), usually showing the marked superiority of the mouse for extended movements across a screen. However, for some applications, a touchscreen yields better performance than the mouse, (Karat, McDonald, & Anderson, 1986). We have been unable to locate any published work that examines age effects.
Thus, we can offer only speculative suggestions about input devices. First, the very old are much more likely than young and middle-age adults to suffer from chronic conditions such as arthritis (Verbrugge, Lepowski, & Konkol, 1991) that would make keyboard interaction difficult. Further, older adults are probably less likely to have typing skills than young adults, particularly older men. It can be expected that use of menu-driven software with direct (absolute positioning) addressing devices such as a touchscreen or a light pen would be the best choice for novice older users. Keyboards likely would present the greatest difficulty for nontypists. Devices such as a mouse, trackball, or joystick probably would be intermediate between the two. Menu designs should pay careful attention to target size given expected problems with homing in on small targets. Target acquisition may be exacerbated by hand tremor or arthritis.
Given the pressures to bring today's complex business software to market quickly, it is more likely that the user must learn to accommodate to the application than it is that the manufacturer or designer will do large-scale studies to test out different interface designs. Efforts must be expended to find effective ways to teach people. In the recent past, it has been claimed that the modal technique for training in small office environments has been to dump the software package in front of the user and ask them to learn it (Czaja, Hammond, Blascovich, & Swede, 1986). Now it is more common for the software designer to include a tutorial, either on line or via a manual, to support training. Some offices also send employees to short seminar courses.
Individual differences only now are being recognized as important mediators of human-computer interaction (e.g., Egan, 1988). A critical, though generally unresolved, issue is whether older adults benefit differentially from some training techniques over others. That is, are there interactions between age and training technique? Some strong claims originated in the early 1960s and 1970s that "discovery learning" techniques were of special benefit to older workers (e.g., Belbin & Belbin, 1972), but the evidence offered in support of this assertion was quite weak. Nonetheless, the idea that people can gain especially from situations where they can actively explore the task environment has resurfaced under other names, for instance, as "exploration training" (Wood & Roth, 1988).
A few studies have contrasted training techniques but have not shown interactions with age for learning software. Gist, Rosen, and Schwoerer (1988) showed that a modeling-plus-tutorial condition was better than a tutorial-only condition, but equally so for young (age < 45 years) and older (age > 45 years) workers learning a spreadsheet. Similarly, no interaction with age was reported by Czaja et al. (1986) in a study of word-processing training. They reported that computer-based training was inferior to instructor-based and manual-based techniques, but equally so for young, middle-age, and older learners. Zandri and Charness (1989) did report an interaction between training technique and age (learning alone or with a peer, with and without preliminary information about computers) for people learning to use a calendar and notepad system on one of three dependent variables. In this case, the old group showed less of a difference in performance on a final test than did the young group as a function of training conditions, though both groups were near perfect. No interactions were evident for time to complete the task or amount of help required. In short, there is little indication that one form of training will be differentially beneficial for older compared to younger computer users.
Generally, though, it can be expected that whatever training regimen is adopted, more time should be permitted for older workers to go through the program and more assistance should be available. Most studies of software training show that older adults acquire new information more slowly than young adults. In word-processing training studies, older adults were either 1.5 times slower (Elias, Elias, Robbins, & Gage, 1987, with trained typists) or 2.5 times slower (Zandri & Charness, 1989, with nontypists) than young adults in proceeding through the self-paced tutorials or test sessions. Gomez, Egan, and Bowers (1986) showed that when a 2 hr time limit was set for completing a text-editing tutorial in their first experiment, age was a significant predictor of those who finished (M = 41 years) versus those who did not (M = 52 years) in their sample of 33 women aged 26-63 years. Age was also a predictor in Experiment 2 of whether subjects finished the advanced lessons in the second test session. Age was also strongly associated with number of first-try errors and execution time/change (bivariate r values over two experiments averaging about .50), making an independent contribution that was usually greater than other significant predictors such as spatial memory and reading skill. In the two studies that kept track of requests for help from the trainer (Elias et al., 1987; Zandri & Charness, 1989), the oldest group required about three times as much help as the youngest group.
One study, however, reported minimal age differences between young (18-30 years) and old (65-75 years) in knowledge acquired about text editing during a computer-assisted six session (12-hr) tutorial (Hartley, Hartley, & Johnson, 1984). The study is described only sketchily, but perhaps the extensive training is responsible for the finding of minimal age differences (12 hr versus 2-3 hr in other studies). Another study (Garfein, Schaie & Willis, 1988) reported no age differences in acquiring knowledge about spreadsheet software following two 1.5-hr tutorials, though the participants' age range (49-67 years) excluded young adults.
Trying to match the user interface to the user's cognitive representation of the task can pay dividends for young adults, particularly in terms of gains in performance with practice (e.g., Roske-Hofstrand & Paap, 1986; Singley & Anderson, 1989). Nonetheless, mental models are not always successful in producing better performance if they are not well tuned to the given task and individual (see the review by Carroll & Reitman Olson, 1988). Given the expectation that older adults will have less efficient working-memory and problem-solving skills when tackling novel tasks, it seems likely that they would benefit differentially from the "training wheels" approach (Carroll & Carrithers, 1984) of limiting the overall complexity of a software application. What types of gains can be expected with older adults remains to be seen. Rate of change with practice on laboratory tasks is usually equivalent for young and old (see the review by Salthouse, 1990), and occasionally slightly greater for the middle age compared with young adults (e.g., Charness & Campbell, 1988).
Attitudes. As a species, humans are characterized by their remarkable adaptiveness. Usually, when a new tool provides a needed function (e.g., the telephone), it is quickly adopted by the population who need that function, though not always (see Ostberg & Chapman, 1988). However, attitudes can play an important role in determining whether the effort to learn to use a new tool is going to be perceived as being worthwhile and that decision is likely to affect training entry and success (Belbin & Belbin, 1972). Particularly with computer technology, which has a history of being seen as frightening and complex (Lee, 1970), those being urged to learn to use it may not be sufficiently motivated to do so. The critical issue here for human factors is whether attitudinal differences exist between younger and older workers that may hamper training efforts.
There is some evidence to suggest that older adults are less likely to report using new technology such as computers, banking machines, and even calculators. Zoltan and Chapanis (1982) obtained attitude information from a sample (N=521) of professionals (CPAs, lawyers, pharmacists, and physicians) in Washington, DC.. They reported that older professionals were much less likely to use computers than younger ones, probably due to training opportunities. They did not report the relation between age and attitudes, though they did find a significantly more positive attitude for users versus nonusers, a variable that is correlated with age in their sample. Arndt, Feltes, and Hanak (1983) found that older individuals were much less likely than younger ones to report use of a word processor in a random sample of secretarial staff at a university. Brickfield (1984) reported a marked decline with age in technology use by a 1981 sample of American Association of Retired Persons members over the age of 45 years. Fig. 10-7 plots the results for their Table 1.
 Figure 10-7 Percentage use of technology
by age from Brickfield (1984), N=750
Figure 10-7 Percentage use of technology
by age from Brickfield (1984), N=750
.Brickfield (1984) also reported that "older people have less positive views toward a variety of technologies than do younger people" (p. 32), though he did not provide any data. Other investigations generally have not found significant age differences in attitudes toward computers. Krauss and Hoyer (1985) found sex differences (men more favorable) but no age differences in attitudes toward computers. They compared employees and spouses of employees who were retirees at a senior center program on computers to undergraduates at Syracuse University, so selection bias may have played a role. Ansley and Erber's (1988) highly educated older volunteers were virtually equivalent to undergraduate students on 10 subscales measuring attitudes toward computers.
Do attitudes predict performance once someone is involved in a training program? In the Gomez et al. (1986) text-editing study attitudes towards computers tended to be slightly negatively correlated with age (r = -.3, -.2), though generally uncorrelated with performance, except for a counterintuitive positive relation between attitudes and the time to make an editing change. Czaja et al. (1986) also failed to show significant relationships between computer attitudes and word-processing performance in their study. Zandri and Charness (1989) showed no relation between initial attitudes and final test performance, though initial attitudes were negatively correlated with time to complete tutorial sessions (r(42) = -.36) and the amount of help requested (r(42) = -.34). However, attitudes toward computers measured before the final test session were positively correlated with test performance. All of the experimental studies of software training have used volunteers who may be expected to have more positive attitudes toward computers than nonvolunteers. Thus, the consistent failure to find a relationship between initial attitudes and performance may not be strongly generalizable. Nonetheless, such negative results suggest that if extra incentives are offered to older workers to retrain, their success in the program may not be jeopardized by any negative attitudes that they may hold initially.
Computers probably will continue to play an increasingly important role in society. The challenge for designers of hardware and software is to enable easier interaction with these devices, particularly for older adults. Any age-related disadvantage in familiarity with microcomputers is likely to be a function of this historical epoch. For future generations of senior citizens the microcomputer is probably going to be as familiar (and perhaps as easy to use) as is the telephone for today's generation10 . Still, a great deal of basic human factors work needs to be conducted on age and computer use. Almost every issue that has been addressed with young populations needs replication with older ones.
Design, whether concerned with the public or private sector, must deal with the cost-benefit issue. A reasonable characterization is provided by Frost (1975): "Cost-benefit analysis is designed to compare two or more solutions to a given problem and to provide a framework in which such comparisons can be usefully discussed" (p. 3). In the minimalist situation, the two solutions can be taken as "doing nothing" and "doing something." Cost-benefit analysis usually involves standardizing outcome variables by determining (and in most cases estimating) their market prices. This quest often leads to fairly speculative exercises, such as determining a monetary value for clean air, travel time, and even a human life. We offer the following example in that spirit.
Consider the case of extending crossing times for pedestrians at signals, discussed earlier. Take the example of a traffic light that allocates more time to east-west traffic than to north-south, with our concern being the pedestrians making the north-south crossing. If we extend the lights for pedestrians by an average of 3 s/light (one project suggested 6 s: Atkinson, 1987) vehicles on the main east-west route are slowed by the same amount.
Assume that in the United States, half of the 2,000 yearly older pedestrian deaths (Sterns et al., 1985) could be avoided this way. This is probably much too generous an estimate, because about half of pedestrian fatalities occur at intersections without signs or traffic lights (Hauer, 1988). Further, drivers who make left turns constitute about one third of the risk to a pedestrian (Yaksich, 1985, Table 3), and they usually have the same green light (except for the case of left-turn signal intersections).
As a first approximation, assume also that the value of a life is $20,00011 (See Mooney, 1977, for a detailed discussion of the problem of assigning a monetary value to life.) A saving of about $20 million thus would be realized, before considering health care, police/ambulance costs, and damage to the vehicle that hits the pedestrian, all of which increase the figure. To provide an upper bound on that figure, we might assign a cost of life of $250,000, yielding a savings of $250 million for 1,000 lives. A lower bound might be that only 250 lives are saved by lengthening lights, yielding an interval of $5 million to $250 million saved.
The fuel consumption cost of idling an automobile is approximately .8 ml/s (estimated from Chang, Evans, Herman, & Wasielewski, 1977). Assuming fuel costs of $.25/l ($1/gallon) or $.00025/ml, yields .00025 x .8 = $.0002/s of idle time. Being stopped at three of the extended traffic lights per day (about 1000/year) for, say, 25 million urban vehicles (there are about 180 million registered autos, trucks and buses in the United States) leads to an estimate of costs ($.0002/s x 3 s delay/light x 1000 lights/year x 25,000,000 vehicles) of $15 million. The $15 million fuel cost figure is obviously only approximate, because fuel costs are rising, though engine efficiency is also increasing. Upper bounds on fuel costs are around $65 million, if you assume that fuel costs are $1.20/gallon and 100 million vehicles are idled at three extended traffic lights daily. In short, much of the savings attributed to lengthened light times and diminished fatalities would be reclaimed by increased fuel consumption alone.
More significantly, drivers who are slowed may be losing time from paid employment. Assuming an average industrial wage of $10/h, the loss of 9 s/day yields a loss of $.025/day. Again, multiplying this by 25 million vehicles yields a cost of about $625,000/day or about $200 million per year. Reasonable upper and lower bounds on cost could come from assuming that there are one to three traffic lights encountered per day, that lost-time costs are valued between $1 (nonpaid time12 ) and $10/h, and that 10 million to 100 million motorists13 encounter lengthened lights. The extremes for these assumptions yield a range of lost-time costs from $3 million to $500 million.
We are making the simplifying assumption that only 3 s are lost at each light, whereas a more sophisticated analysis might show that delays cascade in heavy traffic situations (perhaps doubling or tripling the real time loss). Further, the time (and monetary) loss could be even greater if commuters arrive at work feeling highly stressed and take 15 min or so to cool down.
These calculations also fail to consider the off-setting deaths that might be incurred in producing and distributing the additional millions of liters of gasoline consumed during engine-idling time (though these are probably factored into the cost of fuel), deaths attributable to increased pollution from burning that fuel, and the "savings" to Social Security of having 1,000 older Americans die prematurely. Further, we have assumed that outcomes for younger pedestrians would be unaffected by crossing time changes.
On the other hand, and undoubtedly more important, the analysis thus far fails to consider potential savings for cases where older pedestrians would ("only") have been seriously injured (or even just frightened when nearly hit) and would have consumed expensive health care, hospital care, and nursing home care. Typically, nonfatal accidents outnumber fatal ones by very high ratios. Hauer (1988) cited figures of about 12,000 pedestrians aged 64+ years injured per year, compared to about 2,000 killed. Elimination of half the injuries, valuing the average cost of such an injury at between $1,000 and $10,000, yields additional benefits of between $6 million and $60 million per year.
Further, this analysis ignores the costs of implementing a scheme to lengthen lights. Aside from personnel and equipment costs (Hauer, 1988, indicated that there are about 300,000 signals installed in the United States), there is also what economists term an opportunity cost for such a program. Namely, spending money on this program means that less money is available for other programs that may yield a greater social welfare benefit. As Table 10-4 indicates, from a strictly economic analysis standpoint it sometimes may not "pay" to save lives when all the costs are tallied (with the obvious exception of your own life or the lives of your loved ones).
| Fuel consumption of idled vehicles:
$40 million (range: $15 million to $65 million) | Lives saved: 250 to 1,000:
$123 million (range: $5 million to $250 million) |
| Time lost by drivers:
$250 million (range: $3 million to $500 million) | Nonfatal injuries prevented: 6000
$33 million (range: $6 million to $60 million) |
| Total cost: $290 million | Total benefit: $156 million |
It may prove beneficial in this case to design traffic light systems where a button provides the pedestrian with a longer crossing time, one out of two light changes, or have the system change to longer north-south crossing times after rush-hour periods. Even more important would be a more detailed examination of the 2,000 annual pedestrian fatalities (not to mention nonfatal injuries), followed by field studies, to see to what extent light crossing time is a significant contributing factor. The difficulty of assigning monetary values to the cost and benefit sides in this very rudimentary analysis indicates why so few cost-benefit analyses are conducted, though they are potentially very informative about hidden costs in decision making. Nonetheless, if human factors specialists are to make claims on societal resources through issuing guidelines for products and processes, they will have to convince the public that changes are worthwhile.
Earlier, we suggested that if human factors research focusing upon older adults is to produce design guidelines that supplement those obtained from research with younger adults it must be the case that the conditions of optimal safety, efficiency, and comfort for older adults differ from those for younger adults. We have outlined examples of age by condition interactions for visual performance under different illumination levels and auditory performance in the presence of noise. Such interactions are also quite evident for molar tasks such as driving a motor vehicle safely. Although further research is required to identify other environments and tasks for which age by condition interactions are observed, it seems reasonable to conclude that design guidelines should be developed for older adults. Unfortunately, a limitation of human factors research focusing upon older adults is that specific guidelines for design are often lacking, and those that do exist frequently have a weak empirical basis. We would like to suggest some procedures for data collection that may facilitate the development of sound design guidelines. In addition, we outline some additional content areas within human factors that need to be addressed from an aging perspective.
Our first set of procedural recommendations concerns sampling technique. Specifically, we suggest that research should not employ an extreme groups design, but rather that an attempt be made to incorporate decade samples of older adults, ranging from age 40 years to age 80 years, or beyond, depending on the physical, perceptual, psychomotor, or cognitive functions being investigated. In addition, an attempt should be made to obtain a representative sample. Older adults are a heterogeneous group, and if effective design guidelines are to be developed performance functions that span older adulthood are required. Samples that focus upon a restricted age range and employ volunteer populations who are primarily white, middle class, healthy community-dwelling adults are likely to underestimate interindividual variability. It is critical to obtain an accurate estimate of performance variability because as was discussed previously, if the performance of older adults is so variable that extremely wide design guidelines are required, it may be too costly to implement many guidelines. Design guidelines that are not economically feasible to implement are of no benefit to older adults.
Although difficult, there are several ways in which a representative sample could be obtained. Research teams may try to link up with ongoing studies that already have identified representative samples. It may be feasible to bring the lab to the participant in order to avoid selective refusal based on mobility constraints. Portable computer equipment can facilitate this process, though it cannot eliminate the need for laboratories, particularly for visual performance studies that require tight control of illumination. At worst, more of an effort can be made to seek out groups that are less likely to volunteer for further validation before any recommendations are made.
Our second procedural recommendation is to extend laboratory research on the physical, psychomotor, perceptual, and cognitive capabilities of older adults and attempt to make it more useful for real-world applications. Predictions from laboratory tasks to real-world tasks (e.g., via the parameter estimates given in Charness & Bosman, 1990a) have not yet been subjected to sufficient empirical testing. There are enough counterintuitive findings in field research to suggest that the road will be a rocky one. It is not enough to show that older adults are slower than younger ones on classic choice reaction-time tasks and then assume that this has implications for braking an automobile. As we have seen, driving experience and the very slow response times of even young drivers to unexpected hazards in the real world put their reaction times out of the range of typical laboratory reaction-time studies. Even in laboratory situations, you can show age-related slowing with choice reaction time in the presence of no age-related differences in performance in a task with high face similarity - typing (Bosman, 1991; Salthouse, 1984). When highway design standards are based on perception-response times of 2 s to 2.5 s, there is an urgent need to look at laboratory situations that sample tasks in this time range.
There are several ways in which the results of traditional experimental studies can be extended to real-world situations. First, better use should be made of epidemiological sources of information about aging. Large-scale population studies are available through governments and industry on health, activity, injury, and disability that can be analyzed by age and other demographic features. Most of these data sets are based on questionnaire response data (which has some weaknesses). Nonetheless, secondary analysis can help to provide new hypotheses that can be explored in future experimental studies. Such data sources are particularly valuable for cost-benefit analyses. In addition, a careful task analysis is a necessary step in the research process. Identifying needs of older adults requires careful observation of performance under lifelike circumstances. The results of epidemiological data and task analysis will aid in the identification of tasks and environments that pose special difficulty for older adults, and thus will better enable experimental studies to focus upon tasks and environments that are relevant to the daily lives of older adults. Finally, more experimental field studies should be conducted. The leap from lab to life sometimes can land you in the abyss of unconsidered variables. It is critical to see whether laboratory effects (of illumination level, noise, etc.) are maintained under typical task conditions found in the home and the workplace.
We see three content areas where human factors research concerning older adults might expand: anthropometry, safety, and cost-benefit analyses. First, large scale anthropometric and biomechanical data gathering should be initiated, particularly with respect to dynamic measures such as strength and reach, to provide solid guidelines for the capabilities of older adults. These guidelines probably should be phrased in terms of 95th and 99th percentiles. They also, as much as possible, should be based on the types of challenges faced by adults in their usual environments. For example, age norms should be determined for the type of torque necessary to open a food jar, which is somewhat different from the more commonly used grip-strength measure, though perhaps correlated with it (see Czaja, 1990; Kelley & Kroemer, 1990, for related discussion).
A second important area for human factors research is safety. Older adults are more fragile than are younger ones, and this has serious implications for accident prevention programs, whether dealing with stepstools in the kitchen or automobiles. Detailed analysis of accident data is called for. Centralized recording systems such as the FARS (Fatal Accident Report System, by the National Highway Traffic Safety Administration in the United States) help somewhat, but maintaining information on injury accidents, given their much higher frequency, could be even more useful. Falls during everyday activities now are being studied much more intensively than ever, but the problem here, as with other relatively low-frequency events, is determining the causes so that effective interventions become possible. One option is to make greater use of workers' compensation board injury data, though this will apply only to those still in the labor force. Another possibility is to make greater use of emergency room data bases about product roles in accidents, such as the National Electronic Injury Surveillance System (see, e.g., Czaja, 1990, Table 8).
A third major area for further work is in pinning down the costs and benefits of potential interventions. In our society, for both good and bad reasons, the bottom line is invariably economic. It is unlikely that design guidelines for older adults will be implemented if they are not cost effective. For example, when dealing with a transportation system that constitutes nearly 20% of the Gross National Product, any redesign or intervention may entail a massive investment. Determining the break-even point for such investments is critical in societies with high indebtedness and minimal fiscal flexibility. Including economists and accountants in interdisciplinary teams is one way to proceed.
It is worth returning to the theme that human factors research is likely to set different goals for the different older adult groups. For the middle-age, it seems likely that redesigning the work environment should satisfy their needs for better visual and acoustic support. Given that the middle-age do not differ that much from the young on suprathreshold stimuli, it is also likely that younger adults will benefit from such changes. For the old and the very old, however, where the concerns are likely to be focused in the home and transportation environments, it seems more likely that a broader task analysis will be necessary. Functional analysis based on goals of the older person may point the way to better design.
Finally, as we have indicated previously (Charness & Bosman, 1990a), it is necessary to consult with the user as well as with specialists when redesigning. It makes little sense to redesign a food jar for easier opening if it contains high-salt, high-fat, low-vitamin contents. Similarly, there is little need to provide special transportation vans to take immobile older adults to the bank if technology could offer them a better way to manage their finances (and perhaps to socialize while doing so via a video-phone) at home. Human factors research should be conducted in conjunction with, and not just for, older adults.
Ansley, J., & Erber, J. T. (1988). Computer interaction: Effects on attitudes and performance in older adults. Educational Gerontology, 14, 107-119.
Arndt, S., Feltes, J., & Hanak, J. (1983). Secretarial attitudes toward word processors as a function of familiarity and locus of control. Behaviour and Information Technology, 2, 17-22.
Ashford, N. J. (1981). Transport for the elderly and handicapped. Applied Ergonomics, 12, 87-92.
Atkinson, W. G. (1987). Pedestrian crosswalk signal activation demonstration. MANOP Services Ltd., 1007 Frederick Rd., North Vancouver, British Columbia.
Avolio, B. J., Kroeck, K. G., & Panek, P. E. (1985). Individual differences in information-processing ability as a predictor of motor vehicle accidents. Human Factors, 27, 577-587.
Babarik, P. (1968). Automobile accidents and driver reaction pattern. Journal of Applied Psychology, 52, 49-54.
Belbin, E., & Belbin, R. M. (1972). Problems in adult retraining. London: Heineman.
Beldie, I. P., Pastoor, S., & Schwarz, E. (1983). Fixed versus variable letter width for televised text. Human Factors, 25, 273-277.
Bennett, C. A. (1977). The demographic variables of discomfort glare. Lighting Design and Application, 7, 22-24.
Birren, J. E., Woods, A. M., & Williams, M. V. (1980). Behavioral slowing with aging: Causes, organization, and consequences. In L. W. Poon (Ed.), Aging in the 1980s: Psychological issues (pp. 293-308). Washington, DC: American Psychological Association.
Blackwell, O. M., & Blackwell, H. R. (1971). Visual performance data for 156 normal observers of various ages. Journal of the Illuminating Engineering Society, 1, 3-13.
Bosman, E. A. (1991). Age-related changes in transcription typing skill. Unpublished doctoral dissertation, University of Waterloo, Waterloo, Ontario.
Bowman, K. F., & Cole, B. L. (1980). A recommendation for illumination of the Farnsworth-Munsell 100-Hue Test. American Journal of Optometry and Physiological Optics, 57, 839-842
Boyce, P. R. (1973). Age, illuminance, visual performance and preference. Lighting Research and Technology, 5(3), 125-144.
Boyce, P. R. (1981). Human factors in lighting. Essex, England: Applied Science.
Boyce, P. R., & Simons, R. H. (1977). Hue discrimination and light sources. Lighting Research and Technology, 9, 125-140.
Brickfield, C. F. (1984). Attitudes and perceptions of older people toward technology. In P. K. Robinson & J. E. Birren (Eds.), Aging and technological advances (pp. 31-38). New York: Plenum.
Camp, C. J., West, R. L., & Poon, L. W. (1989). Recruitment practices for psychological research in gerontology. In M. P. Lawton & A. R. Herzog (Eds.), Special research methods for gerontology (pp. 163-189). Amityville, NY: Baywood.
Card, S., English, W., & Burr, B. (1978). Evaluation of mouse, rate-controlled isometric joystick, step keys, and text keys for text selection on a CRT. Ergonomics, 21, 601-613.
Card, S. K., Moran, T. P., & Newell, A. (1983). The psychology of human-computer interaction. Hillsdale, NJ: Erlbaum.
Carroll, J. M., & Carrithers, C. (1984). Blocking learner error states in a training-wheels system. Human Factors, 26, 377-389.
Carroll, J. M., & Reitman Olson, J. (1988). Mental models in human-computer interaction. In M. Helander (Ed.), Handbook of human-computer interaction (pp. 45-65). Amsterdam: North-Holland.
Cerella, J. (1985). Age-related decline in extrafoveal letter perception. Journal of Gerontology, 40, 727-736.
Cerella, J. (1990). Aging and information-processing rate. In J. E. Birren and K. W. Schaie (Eds.), Handbook of the psychology of aging, (3rd Ed.) (pp. 201-221). San Diego: Academic Press.
Chang, M., Evans, L., Herman, R., & Wasielewski, P. (1977). Observations of fuel savings due to the introduction of right-turn-on-red. Traffic Engineering & Control, 18, 475-477.
Charness, N. (Ed.) (1985). Aging and human performance. Chichester, UK: John Wiley & Sons.
Charness, N., & Bosman, E. A. (1990a). Human factors and design for older adults. In J. E. Birren & K. W. Schaie (Eds.), Handbook of the psychology of aging (3rd Ed.) (pp. 446-463). New York: Academic Press.
Charness, N., & Bosman, E. A. (1990b). Expertise and aging: Life in the lab. In T. H. Hess (Ed.), Aging and cognition: Knowledge organization and utilization (pp. 343-385). Amsterdam: Elsevier.
Charness, N., & Campbell, J. I. D. (1988). Acquiring skill at mental calculation in adulthood: A task decomposition. Journal of Experimental Psychology: General, 117, 115-129.
Clark, M. C., Czaja, S. J., & Weber, R. A. (1990). Older adults and daily living task profiles. Human Factors, 32, 537-549.
Committee for the Study on Improving Mobility and Safety for Older Persons (1988). Transportation in an aging society: Improving mobility and safety for older persons (Vols. 1-2). Washington, DC: Transportation Research Board, National Research Council.
Cross-National Study: Older people in traffic - How dangerous? (1989). Ageing International, 26, 35-38.
Cushman, W.H., & Crist, B. (1987). Illumination. In G. Salvendy (Ed.), Handbook of human factors (pp.670-695). New York: John Wiley & Sons.
Czaja, S. J. (Ed.) (1990). Human factors research needs for an aging population. Washington, DC: National Academy Press. (Available from National Research Council, 2101 Constitution Avenue, NW, Washington, DC, 20418.)
Czaja, S.J., Hammond, K., Blascovich, J.L., & Swede, H. (1986). Learning to use a word-processing system as a function of training strategy. Behavior and Information Technology, 5, 203-216.
Davidson, H., Schonfield, D., & Winkelaar, R. (1982). Age differences in the effects of reverberation and pause on sentence intelligibility. Canadian Journal on Aging, 1, 29-37.
Denton, F. T., Feaver, C. H., & Spencer, B. G. (1986). Prospective aging of the population and its implications for the labour force and government expenditures. Canadian Journal on Aging, 5, 75-95.
Egan, D. E. (1988). Individual differences in human-computer interaction. In M. Helander (Ed.), Handbook of human-computer interaction (pp. 543-568). Amsterdam: North-Holland.
Elias, P. K., Elias, M. F., Robbins, M. A., & Gage, P. (1987). Acquisition of word-processing skills by younger, middle-age, and older adults. Psychology and Aging, 2, 340-348.
Evans, D. W., & Ginsburg, A. P. (1985). Contrast sensitivity predicts age-related differences in highway sign discriminability. Human Factors, 27, 637-642.
Evans, L. (1988a). Older driver involvement in fatal and severe traffic crashes. Journal of Gerontology, 43, S186-S193.
Evans, L. (1988b). Risk of fatality from physical trauma versus sex and age. The Journal of Trauma, 28, 368-378.
Evans, L. (1991). Traffic safety and the driver. New York: Van Nostrand Reinhold.
Faletti, M. V. (1984). Human factors research and functional environments for the aged. In I. Altman, M. P. Lawton, & J. F. Wohlwill (Eds.), Human behavior and environment: Advances in theory and research: Vol. 7. Elderly people and the environment (pp. 191-237). New York: Plenum.
Flynn, J. E. (1979). The IES approach to recommendations regarding levels of illumination. Lighting Design & Application, 9(September), 74-77.
Forbes, W. F., Hayward, L. M. & Agwani, N. (1991). Factors associated with the prevalence of various self-reported impairments among older people residing in the community. Canadian Journal of Public Health, 82, 240-244.
Fozard, J. L. (1981). Special issue preface. Human Factors, 23, 3-6.
Fozard, J. L. (1990). Vision and hearing in aging. In J. E. Birren & K. W. Schaie (Eds.), Handbook of the psychology of aging (3rd Ed.) (pp. 150-170). New York: Academic Press.
Fozard, J. L., & Popkin, S. J. (1978). Optimizing adult development: Ends and means of an applied psychology of aging. American Psychologist, 33, 975-989.
Frost, M. J. (1975). How to use cost benefit analysis in project appraisal. Epping, England: Gower.
Garfein, A. J., Schaie, K. W., & Willis, S. L. (1988). Microcomputer proficiency in later-middle-aged and older adults: Teaching old dogs new tricks. Social Behavior, 3, 11-148.
Gist, M., Rosen, B., & Schwoerer, C. (1988). The influence of training method and trainee age on the acquisition of computer skills. Personnel Psychology, 41, 255-265.
Gomez, L. M., Egan, D. E., & Bowers, C. (1986). Learning to use a text-editor: Some learner characteristics that predict success. Human-Computer Interaction, 2, 1-23.
Gould, J. D., Alfaro, L., Finn, R., Haupt, B., & Minuto, A. (1987). Reading from CRT displays can be as fast as reading from paper. Human Factors, 29, 497-517.
Government of Canada (1987). Housing an aging population: Guidelines for development and design. Canada: National Advisory Council on Aging. Ministry of Supply & Services, (ISBN: 0-662-15640-4, Catalogue: H-71-3/6-1987E).
Grandjean, E., & Vigliani, E. (Eds.) (1980). Ergonomic aspects of visual display terminals. London: Taylor & Francis.
Greenstein, J. S., & Arnaut, L. Y. (1988). Input devices. In M. Helander (Ed.), Handbook of human-computer interaction (pp. 495-519). Amsterdam: North-Holland.
Guth, S. K., Eastman, A. A., & McNelis, J. F. (1956). Lighting requirements for older workers. Illumination Engineering, 11, 656-660.
Halpern, D. F. (1984). Age differences in response time to verbal and symbolic traffic signs. Experimental Aging Research, 19, 201-204.
Harrington, D. M., & McBride, R. S. (1970). Traffic violations by type, age, sex, and marital status. Accident Analysis and Prevention, 2, 67-79.
Hartley, A. A., Hartley, J. T., & Johnson, S. A. (1984). The older adult as computer user. In P. K. Robinson & J. E. Birren (Eds.), Aging and technological advances (pp.347-348). New York: Plenum Press.
Hauer, E. (1988). The safety of older persons at intersections. In Transportation in an aging society: Improving mobility and safety for older persons Vol. 2 (pp. 194-252). Washington, DC: Transportation Research Board, National Research Council.
Helander, M. G. (1987). Design of visual displays. In G. Salvendy (Ed.), Handbook of human factors (pp. 507-548). New York: Wiley.
Hoag, L. L., & Adams, S. K. (1975). Human factors in urban transportation. Human Factors, 17, 119-131.
Hughes, P. C., & McNelis, J. F. (1978). Lighting, productivity, and the work environment. Lighting Research and Design, 8, 32-40.
Hughes, P. C., & Neer, R. M. (1981). Lighting for the elderly: A psychobiological approach to lighting. Human Factors, 23(1), 65-85.
Huston, R. E., & Janke, M. K. (1986). Senior driver facts (Report No. CAL-DMV-RSS-86-82, 2nd ed.). Springfield, VA: Technical Information Service.
Jaschinski, W. (1982). Conditions of emergency lighting. Ergonomics, 25, 363-372.
Johnson, C. A., & Keltner, J. L. (1983). Incidence of visual field loss in 20,000 eyes and its relationship to driving performance. Archives of Ophthalmology, 101, 371-375.
Kantowitz, B. H., & Sorkin, R. D. (1983). Human factors: Understanding people-system relationships. New York: John Wiley & Sons .
Karat, J., McDonald, E., & Anderson, M. (1986). A comparison of menu selection techniques: Touch panel, mouse and keyboard. International Journal of Man-Machine Studies, 25, 73-88.
Kaufman, J. E., & Haynes, H., (Eds.). (1981a). Illumination Engineering Society lighting handbook: Reference volume. New York: Illuminating Engineering Society of North America.
Kaufman, J. E., & Haynes, H., (Eds.). (1981b). Illumination Engineering Society lighting handbook: Application volume. New York: Illuminating Engineering Society of North America.
Kelly, P. L., & Kroemer, K. H. E. (1990). Anthropometry of the elderly: Status and recommendations. Human Factors, 32, 571-595.
Kline, D. W., & Schieber, F. (1985). Vision and aging. In J. E. Birren & K. W. Schaie (Eds.), Handbook of the psychology of aging, 2nd Edition (pp. 296-331). New York: Van Nostrand Reinhold.
Kline, T. J. B., Ghali, L. M., Kline, D. W., & Brown, S. (1990). Visibility distance of highway signs among young, middle-aged, and older observers: Icons are better than text. Human Factors, 32, 609-619.
Knoblauch, K., Saunders, F., Kusuda, M., Hynes, R., Podgor, M., Higgins, K.E., & de Monasterio, F. M. (1987). Age and illuminance effects of the Farnsworth-Munsell 100-hue test. Applied Optics, 26, 1441-1448.
Koncelik, J. A. (1982). Aging and the product environment. New York: Van Nostrand Reinhold.
Korteling, J. E. (1990). Perception-response speed and driving capabilities of brain-damaged and older drivers. Human Factors, 32, 95-108.
Krauss, I. K., & Hoyer, W. J. (1985). Technology and the older person: Age, sex, and experience as moderators of attitudes towards computers. In P. K. Robinson, J. Livingston, & J. E. Birren (Eds.), Aging and technological advances (pp. 349-350). New York: Plenum.
Kroemer, K. H. E., & Hill, S. G. (1986). Preferred line of sight angle. Ergonomics, 29, 1129-1134.
Lee, R. S. (1970). Social attitudes and the computer revolution. Public Opinion Quarterly, 34, 53-59.
MacKay, M. (1988). Crash protection for older persons. In Transportation in an aging society: Improving mobility and safety for older persons Vol. 2 (pp. 158-193). Washington, DC: Transportation Research Board, National Research Council.
Mathey, F. J. (1983). Attitudes and behavior of elderly pedestrians. International Journal of Aging and Human Development, 17, 25-28.
Matthews, M.L. (1986). Aging and the perception of driving risk and ability. Proceedings of the Human Factors Society - 30th Annual Meeting - P. 1159-1163. Santa Monica, California: Human Factors Society.
McKnight, A. J. (1988). Driver and pedestrian training. In Transportation in an aging society: Improving mobility and safety for older persons Vol. 2. (pp. 101-133), Washington, D.C.: Transportation Research Board, National Research Council.
Mihal, W. J., & Barrett, G. V. (1976). Individual differences in perceptual information processing and their relation to automobile accident involvement. Journal of Applied Psychology, 61, 229-233.
Miyao, M., Hacisalihzade, S. S., Allen, J. S., & Stark, L. W. (1989). Effects of VDT resolution on visual fatigue and readability: An eye movement approach. Ergonomics, 32, 603-614.
Money, L. J. (1984). Transportation energy and the future. Englewood Cliffs, NJ: Prentice-Hall.
Mooney, G. H. (1977). The valuation of human life. London: MacMillan.
Mortimer, R. G. (1988). Headlamp performance factors affecting the visibility of older drivers in night driving. In Transportation in an aging society: Improving mobility and safety for older persons Vol. 2 (pp. 379-403). Washington, D.C.: Transportation Research Board, National Research Council.
Moss, M., & Lawton, M. P. (1982). The time budgets of older people: A window on four lifestyles. Journal of Gerontology, 37, 115-123.
Mourant, R. R., & Langolf, G. D. (1976). Luminance specifications for automobile instrument panels. Human Factors, 18, 71-84.
Olsho, L. W., Harkins, S. W., & Lenhardt, M. L. (1985). Aging and the auditory system. In J. E. Birren & K. W. Schaie (Eds.), Handbook of the psychology of aging 2nd Edition (pp. 332-377). New York: Van Nostrand Reinhold.
Olson, P. (1988). Motor vehicle headlighting: A classic problem in ergonomics. University of Michigan Transportation Research Institute Research Review, 18(6), 1-10.
Olson, P. L., & Sivak, M. (1986). Perception-response time to unexpected roadway hazards. Human Factors, 28, 91-96.
Ostberg, O., & Chapman, L. J. (1988). Social aspects of computer use. In M. Helander (Ed.), Handbook of human-computer interaction (pp. 1033-1049). Amsterdam: North-Holland.
Owsley, C., Ball, K., Sloane, M. E., Roenker, D. L. & Bruni, J. R. (1991). Visual/cognitive correlates of vehicle accidents in older drivers. Psychology and Aging, 6, 403-415.
Panek, P. E., Barrett, G. V., Sterns, H. L., & Alexander, R.A. (1978). Age differences in perceptual style, selective attention, and perceptual-motor reaction time. Experimental Aging Research, 4, 377-387.
Parmelee, P. A., & Lawton, M. P. (1990). The design of special environments for the aged. In J. E. Birren & K. W. Schaie (Eds.), Handbook of the psychology of aging (3rd Ed.) (pp. 464-488). New York: Academic Press.
Pastoor, S., Schwarz, E., & Beldie, I. P. (1983). The relative suitability of four dot-matrix sizes for text presentation on color television screens. Human Factors, 25, 265-272.
Planek, T. W. (1972). The aging driver in today's traffic: A critical review. In P. F. Waller (Ed.), Aging and highway safety: The elderly in a mobile society (pp. 3-38).Chapel Hill, NC: North Carolina Symposium on Highway Safety.
Planek, T. W., & Fowler, R. C. (1971). Traffic accident problems and exposure characteristics of the aging driver. Journal of Gerontology, 26, 224-230.
Plomp, R., & Duquesnoy, A. J. (1980). Room acoustics for the aged. Journal of the Acoustical Society of America, 68, 1616-1621.
Plomp, R., & Mimpen, A. M. (1979). Speech-reception threshold for sentences as a function of age and noise level. Journal of the Acoustical Society of America, 66, 1333-1342.
Regnier, V., & Pynoos, J. (1987). Housing the aged. New York: Elsevier.
Report of the World Assembly on Aging (1982). (Report No. A/CONF.113/31 [Sales No. E.82.I.16]). New York: United Nations.
Road Transport Research (1986). Guidelines for improving the safety of elderly road users. Paris: OECD.
Rosenthal, R., & Rosnow, R. L. (1975). The volunteer subject. New York: John Wiley & Sons.
Roske-Hofstrand, R. J., & Paap, K. R. (1986). Cognitive networks as a guide to menu organization: An application in the automated cockpit. Ergonomics, 29, 1301-1311.
Ross, D. K. (1978). Task lighting -- yet another view. Lighting Design and Application, 8, 37-43.
Salthouse, T. A. (1984). Effects of age and skill in typing. Journal of Experimental Psychology: General, 13, 345-371.
Salthouse, T. A. (1985a). A theory of cognitive aging. Amsterdam: Elsevier Science Publishers.
Salthouse, T. A. (1985b). Speed of behavior and its implications for cognition. In J. E. Birren & K. W. Schaie (Eds.), Handbook of the psychology of aging, 2nd Edition (pp. 400-426). New York: Van Nostrand Reinhold.
Salthouse, T. A. (1990). Influence of experience on age differences in cognitive functioning. Human Factors, 32, 551-569.
Sanders, M. S., & McCormick, E. J. (1987). Human factors in engineering design (6th ed.). New York: McGraw-Hill.
Scialfa, C. T., Guzy, L. T., Leibowitz, H. W., Garvey, P. M., & Tyrrell, R. A. (1991). Age differences in estimating vehicle velocity. Psychology and Aging, 6, 60-66.
Second Conference on the Epidemiology of Aging (1980). Proceedings of the Second Conference, March 28-29, 1977, National Institutes of Health, Bethesda, Md. (NIH Publication No. 80-969).
Sekuler, R., Kline, D., Dismukes, K., & Adams, A. J. (1983). Some research needs in aging and visual perception. Vision Research, 23, 213-216.
Shinar, D., McDowell, E. D., Rackoff, N. J., & Rockwell, T. H. (1978). Field dependence and driver visual search behavior. Human Factors, 20, 553-559.
Simmons, R. C. (1975). Illuminance, diversity and disability glare in emergency lighting. Lighting Research and Technology, 5(2), 125-132.
Singley, M. K., & Anderson, J. R. (1989). The transfer of cognitive skill. Cambridge, MA.: Harvard University Press.
Sivak, M. (1981). Human factors and highway-accident causation: Some theoretical considerations. Accident Analysis and Prevention, 13, 61-64.
Sivak, M., & Olson, P. L. (1982). Nighttime legibility of traffic signs: Conditions eliminating the effects of driver age and disability glare. Accident Analysis and Prevention, 14, 87-93.
Sivak, M., Olson, P. L., & Pastalan, L. A. (1981). Effect of driver's age on nighttime legibility of highway signs. Human Factors, 23, 59-64.
Smith, D. B. D. (1990). Human factors and aging: An overview of research needs and application opportunities. Human Factors, 35, 509-526.
Smith, S. W., & Rea, M. S. (1978). Proofreading under different levels of illumination. Journal of the Illumination Engineering Society, 8(October), 46-52.
Sojourner, R. J., & Antin, J. F. (1990). The effects of a simulated head-up display speedometer on perceptual task performance. Human Factors, 32, 329-339.
Solomon, D. (1985). The older driver and highway design. In J. L. Malfetti (Ed.), Drivers 55 +. Needs and problems of older drivers: Survey results and recommendations. Orlando, Florida: Proceedings of the Older Driver Colloquium.
Sterns, H. L., Barrett, G. V., & Alexander, R. A. (1985). Accidents and the aging individual. In J. E. Birren & K. W. Schaie (Eds.), Handbook of the psychology of aging, 2nd Edition (pp. 703-724). New York: Van Nostrand Reinhold.
Stine, E. L., & Wingfield, A. (1987). Process and strategy in memory for speech among younger and older adults. Psychology and Aging, 2, 272-379.
Stine, E. L., Wingfield, A., & Poon, L. W. (1986). How much and how fast: Rapid processing of spoken language in later adulthood. Psychology and Aging, 1, 303-311.
Stoudt, H. W., Damon, A., McFarland, R. A., & Roberts J. (1965). Weight, height, and selected body dimensions of adults. Vital and health statistics, (Series 11, No. 8). Rockville, MD: Public Health Service.
Stoudt, H. W., Damon, A., McFarland, R. A., & Roberts J. (1973). Skinfolds, body girths, biacromial diameter and selected anthropometric indices of adults. Vital and health statistics, (Series 11, No. 35). Rockville, MD: Public Health Service.
Sturr, J. F., Kline, G. E., & Taub, H. A. (1990). Performance of young and older drivers on a static acuity test under photopic and mesopic luminance conditions. Human Factors, 32, 1-8.
Svanborg, A. (1984). Technology, aging and health in a medical perspective. In P. K. Robinson & J. E. Birren (Eds.), Aging and technological advances (pp. 159-168). New York: Plenum.
Todd, M., Davis, K. E., & Cafferty, T. P. (1983). Who volunteers for adult development research?: Research findings and practical steps to reach low volunteering groups. International Journal of Aging and Human Development, 18, 177-184.
Van Houten, R. & Nau, P.A. (1983). Feedback interventions and driving speed: A parametric and comparative analysis. Journal of Applied Behavior Analysis, 16, 253-281.
Verbrugge, L. M., Lepowski, J. M., & Konkol, L. L. (1991). Levels of disability among U.S. adults with arthritis. Journal of Gerontology, 46, 571-83.
Waller, J. A. (1967). Cardiovascular disease, aging, and traffic accidents. Journal of Chronic Diseases, 20, 615-620.
Welford, A. T. (1958). Ageing and human skill. London: Oxford University Press.
Welford, A. T. (1977). Motor performance. In J. E. Birren & K. W. Schaie (Eds.), Handbook of the psychology of aging (pp. 450-496). New York: Van Nostrand Reinhold.
Wingfield, A., Poon, L. W., Lombardi, L., & Lowe, D. (1985). Speed of processing in normal aging: Effects of speech rate, linguistic structure, and processing time. Journal of Gerontology, 40, 579-585.
Winter, D. J. (1984). Needs and problems of older drivers and pedestrians: An exploratory study with teaching/learning implications. Educational Gerontology, 10, 135-146.
Witkin, H. A., Lewis, H. B., Hertzman, M., Machover, K., Meissner, P. B. & Wapner, S. (1954). Personality through perception. New York: Harper.
Wood, D. D., & Roth, E. M. (1988). Cognitive systems engineering. In M. Helander (Ed.), Handbook of human-computer interaction (pp. 3-43). Amsterdam: North-Holland.
Woodson, W. E. (1981). Human factors design handbook. New York: McGraw Hill.
Woltman, H. L., Stanton, R. H., & Stearns, R. A. (1984). Information sign color evaluation using a video presentation. Transportation Research Record, (No. 996). Transportation Research Board, National Research Council, USA.
Working Group on Speech Understanding and Aging, CHABA. (1988). Speech understanding and aging. Journal of the Acoustical Society of America, 83, 859-895.
Yaksich, S. Jr. (1985). Interaction of older drivers with pedestrians in traffic. In J. L. Malfetti (Ed.), Drivers 55+. Needs and problems of older drivers: Survey results and recommendations. Orlando, Florida: Proceedings of the Older Driver Colloquium.
Zandri, E., & Charness, N. (1989). Training older and younger adults to use software. Educational Gerontology, 15, 615-631.
Zoltan, E., & Chapanis, A. (1982). What do professional persons think about computers? Behavior and Information Technology, 1, 55-68.
This work was supported by grants to the authors from the Natural Sciences and Engineering Research Council of Canada (NSERC A0790), Bell Northern-Research, and the National Centres of Excellence Program for the Canadian Aging Research Network (CARNET).
We are grateful to Leonard Evans and Van Nostrand Reinhold for
permission to use the two figures on severe crashes and driver
fatalities. We thank Pat Telford for help with the literature
review,William Forbes for earlier comments on the cost-benefit
analysis, Stephen Godwin, Transportation Research Board, for providing
us with early drafts of papers on aging and driving, and Don Kline,
Kathy Pichora-Fuller, and Bob Dewar for helpful advice. We are
indebted to Tim Salthouse and Gus Craik for expert feedback on
the first draft.